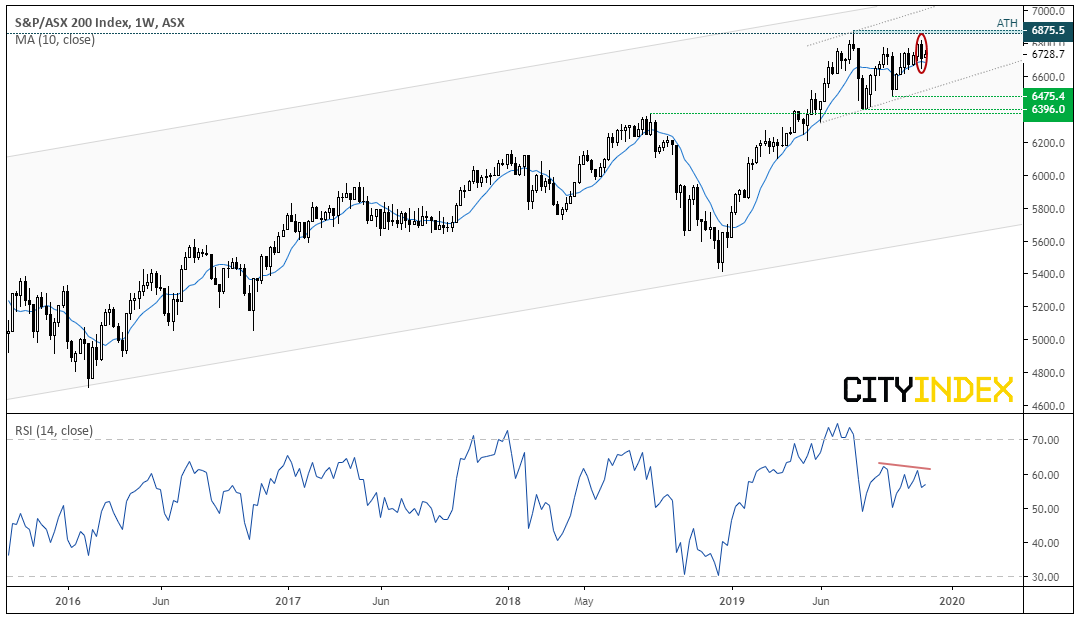
By Friday’s close, the had produced a bearish outside week after failing to hold above 6,800, which raises the potential for some mean reversion. Given the slight bearish divergence forming with RSI and the clear loss of momentum leading it back towards its all-time high, we explore the bearish potential of this classic candlestick pattern to see if it can pull the run from under Santa’s rally in December.
The test: Using Reuters data since April 2000, we filtered all bearish outside candles on the weekly chart. We have then calculated forward returns following a bearish outside candle, along with the % of bullish closes of the forward returns.
As we’re testing a bearish pattern, ideally we’d want to see negative returns with a % bullish rate below 50%.
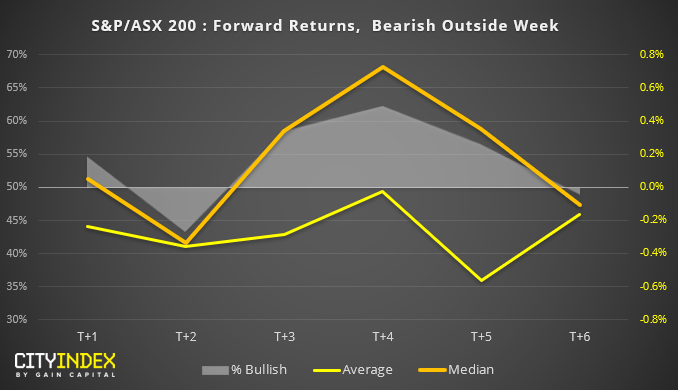
The week following a bearish outside candle tends to close higher more often than not and median returns are also positive, whilst average returns are negative (currently the ASX200 is trading higher this week but we’ll see how this plays out).From this data set, 2 weeks after a bearish outside week has produced the most bearish returns on average, with the highest success rate (as they only close higher on 43.4% of the times). Also note that median returns are also negative suggesting the results are more consistent.Whilst average returns are negative between 1-6 weeks after the pattern, median returns (or typical returns) are positive and close higher over 50% of the time. This suggests a few outliers have pushed average returns into negative territory, yet they typically close higher more often than not.However, as this filters all bearish outside candles, trend direction has not been considered. So next we apply a rule where the pattern must close above or below its 10-week average to denote a basic trend filter.
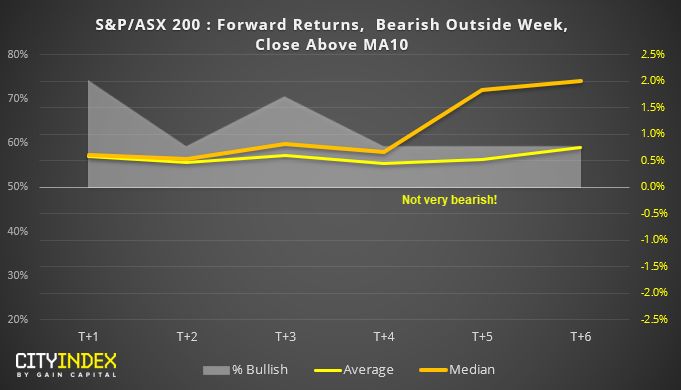
Bearish outside day with a close above its 10-week MA
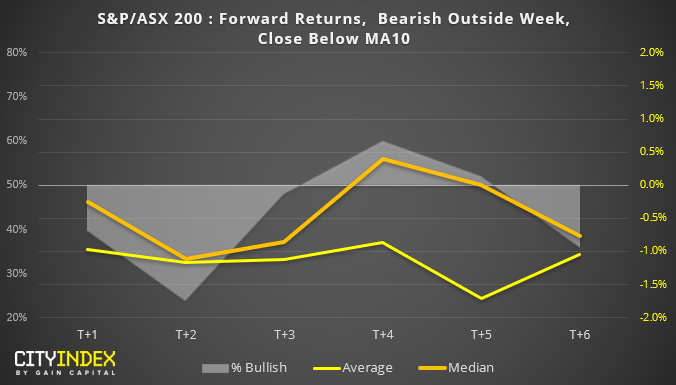
In short, not very bearish at all.Average and median returns are positive between 1 to 6 weeks later, and all have a positive expectancy with % bullish above zero.It’s interesting to note that median returns accelerate 5-6 weeks laterThe week after the pattern (or this week) has a % bullish rate of 75%!However, there are only 27 instances of this occurring since 2000 (generally its good practice to have a minimum of 30 occurrences).Bearish outside day with a close below its 10-week MA
That’s a bit more like it…Again we see +2 weeks as optimal to bears, as both average and median returns are bearish. Moreover, bullish closes are just 24% which means it has closed lower 76% of the time.The relationship breaks down around 4 weeks later as median returns are positive over 50% of the time.Ultimately, it has been better at picking near-term reversals over longer-term ones.However, there are only 25 instances of this occurring since 2000 which is below the ideal sample of 30 or above.Final thoughts:
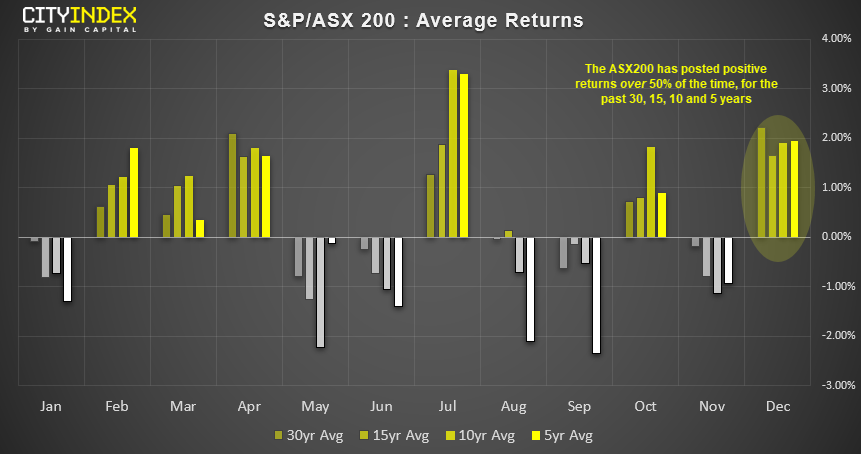
Two weeks after a bearish engulfing candle appears optimum for bears, unless it has closed above its 10-week MA. (take note, the ASX200 closed above its 10-week MA last week).With average, median and % of bullish closes all positive up to 6 weeks after the pattern, it appears to be more of a bear-trap signal if anything.Moreover, December has historically been the most bullish month of the year for the ASX200. Average returns are over 2% over the past 30 years, and it has also posted positive average returns over 50% of the time over the past 30, 15, 10 and 5 years.Given its tendency to rally in December and post positive returns if a bearish engulfing candle closes above its 10-week average, the ASX200 could still rally over the next few weeks.Original Post
