Black Friday is Now! Don’t miss out on up to 60% OFF InvestingProCLAIM SALE

AUD/NZD Bears Bumping Into Fibonacci Support

Published 06/19/2018, 05:54 AM
Updated 07/09/2023, 06:31 AM
AUD/NZD
-

Earlier this month we published an article about AUD/NZD, sharing two slightly different, but both bullish counts, which are supposed to eventually lift the pair to 1.1500 or higher. It is too early to say how this is going, but at least the short-term outlook seems to support the bigger picture.

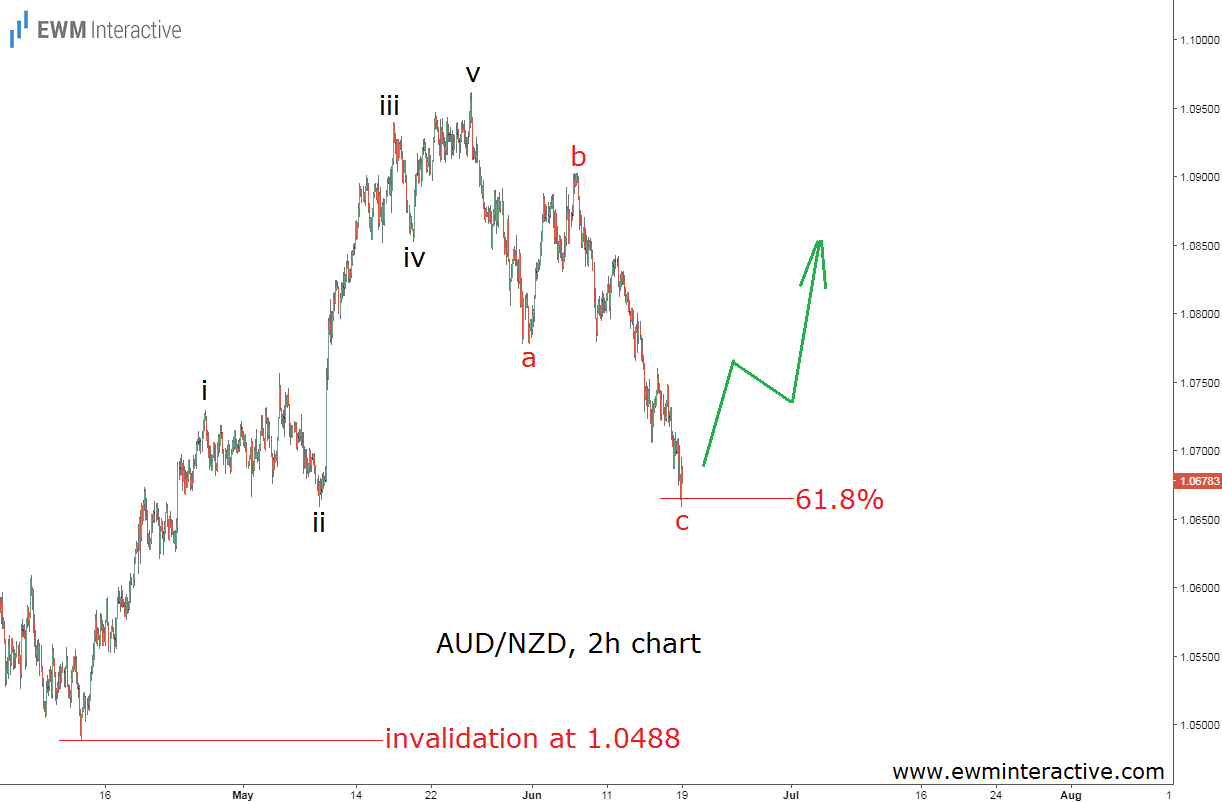
AUD/NZD has been declining from its late-May high of 1.0962 to 1.0658 so far. The following 2-hour chart will help us find out if this selloff fits into a larger Elliott Wave pattern and what it means.
AUD/NZD 2 Hour Chart

It looks like the current weakness actually precedes a five-wave impulse to the upside from 1.0488 to 1.0962. This pattern, whose sub-waves we are going to label i-ii-iii-iv-v, comes to tell us that the bulls remain on the wheel as long as AUD/NZD trades above 1.0488. On the other hand, every impulse is followed by a three-wave correction in the other direction.

The recent plunge appears to be a natural simple a-b-c retracement, which is now touching the 61.8% Fibonacci level. This support level often happens to discourage the bears. Given the now complete bullish 5-3 wave cycle, we should expect more strength in AUD/NZD from now on, because the theory states that once the corrective phase of the cycle ends, the trend resumes in the direction of the impulsive sequence.

Original post

Latest comments

Loading next article…
Risk Disclosure: Trading in financial instruments and/or cryptocurrencies involves high risks including the risk of losing some, or all, of your investment amount, and may not be suitable for all investors. Prices of cryptocurrencies are extremely volatile and may be affected by external factors such as financial, regulatory or political events. Trading on margin increases the financial risks.
Before deciding to trade in financial instrument or cryptocurrencies you should be fully informed of the risks and costs associated with trading the financial markets, carefully consider your investment objectives, level of experience, and risk appetite, and seek professional advice where needed.
Fusion Media would like to remind you that the data contained in this website is not necessarily real-time nor accurate. The data and prices on the website are not necessarily provided by any market or exchange, but may be provided by market makers, and so prices may not be accurate and may differ from the actual price at any given market, meaning prices are indicative and not appropriate for trading purposes. Fusion Media and any provider of the data contained in this website will not accept liability for any loss or damage as a result of your trading, or your reliance on the information contained within this website.
It is prohibited to use, store, reproduce, display, modify, transmit or distribute the data contained in this website without the explicit prior written permission of Fusion Media and/or the data provider. All intellectual property rights are reserved by the providers and/or the exchange providing the data contained in this website.
Fusion Media may be compensated by the advertisers that appear on the website, based on your interaction with the advertisements or advertisers.
© 2007-2024 - Fusion Media Limited. All Rights Reserved.