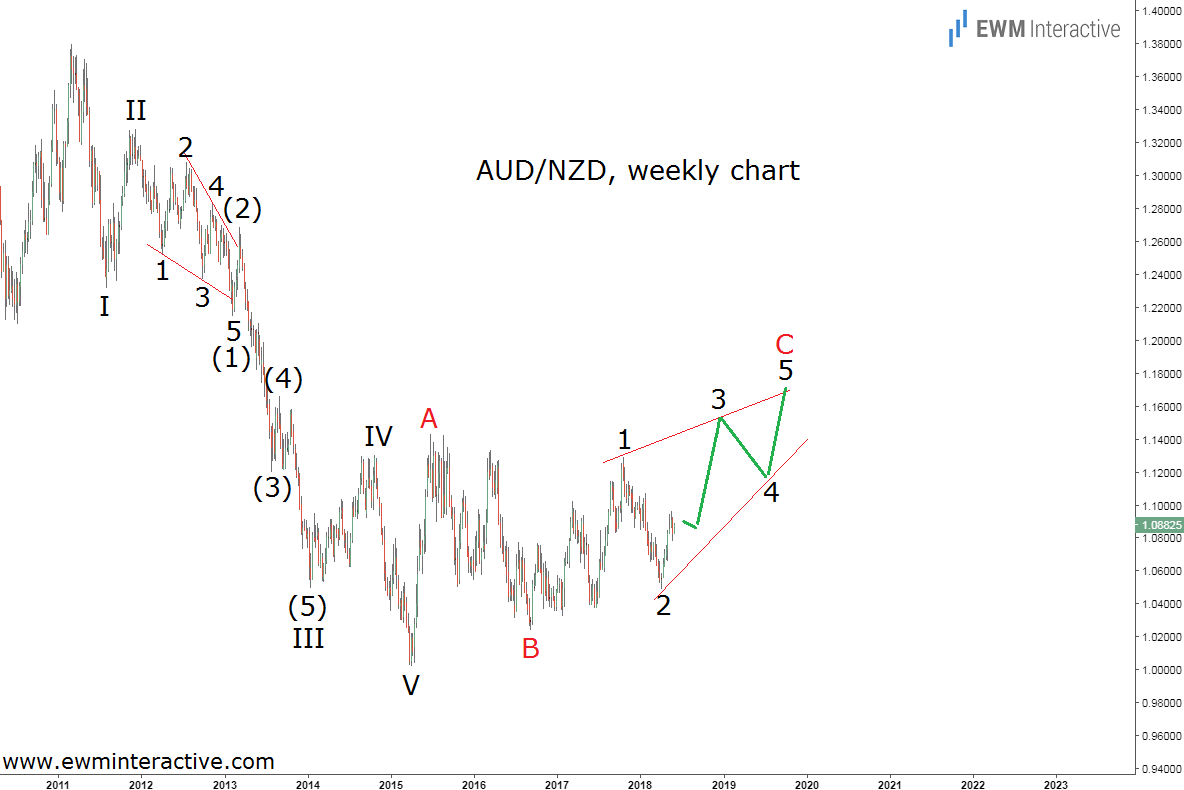
It has been almost two years since we examined the weekly chart of AUD/NZD and concluded that the pair was likely to “Throw a Surprise Bulls Party”. And indeed, the Australian dollar managed to climb to 1.1290 against the New Zealand counterpart by October 2017. Unfortunately, that was the best the bulls were capable of and as of this writing the pair is hovering around 1.0880. That is definitely not what we meant by “bull party”, so let’s take another look and see how the weekly chart has changed during the last couple of years.
The first thing that immediately grabs the attention of the Elliott Wave analyst is the five-wave impulse from 1.3795 to 1.0020 between March 2011 and April 2015. This pattern made us think the recovery to 1.1429 is part of a three-wave correction and it was the very reason to expect more strength in wave C, which was supposed to exceed the top of wave A.
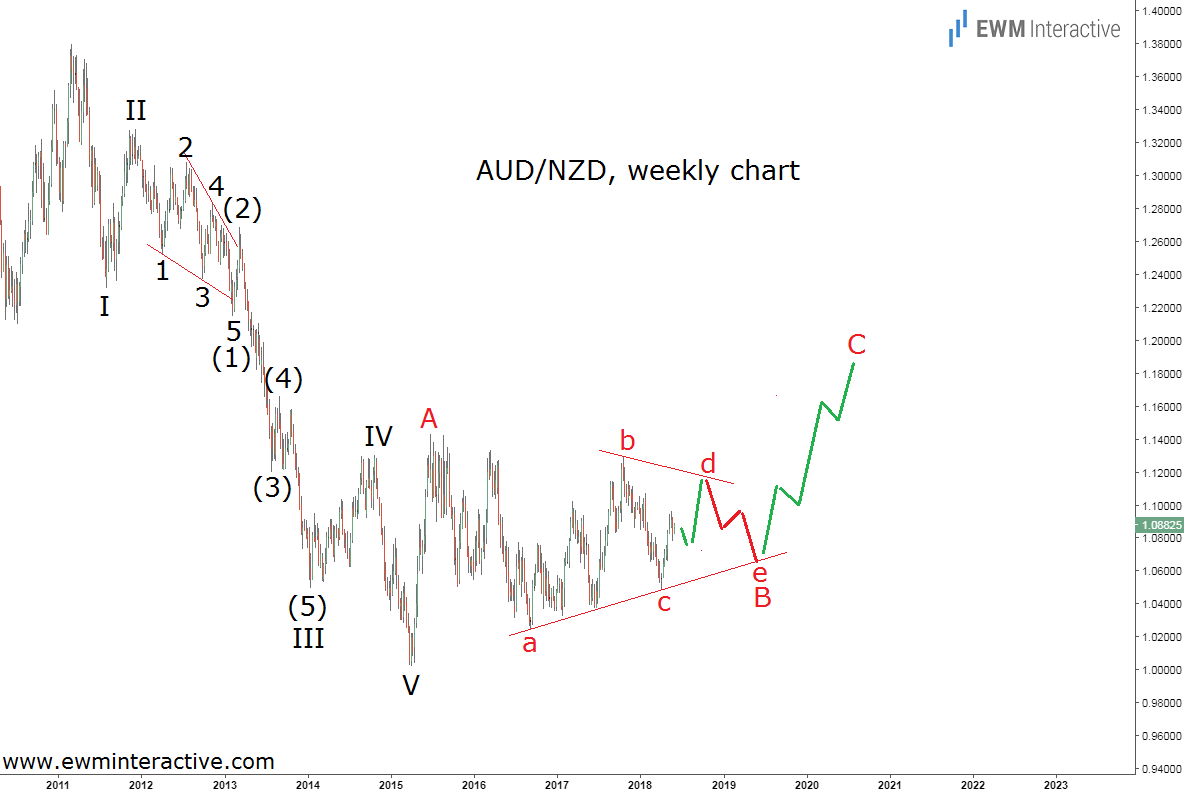
But as the chart above shows, it has not been able to do so, which means the three-wave rally from 1.0020 is still in progress. This leaves the bulls with two options: the first one, shown above, suggests wave B ended at 1.0237 in September 2016 and wave C is developing as an ending diagonal. The alternative is given on the next chart.

It might turn out wave B did not end at 1.0237, but is still under construction as a triangle, whose wave “d” up is currently developing. If the market chooses this scenario, we are going to see another decline in wave “e” of B, before the bulls get their job done in wave C. The good news is that both counts point to the north. Sooner or later AUD/NZD could be expected to reach 1.1500 or even 1.1800.
