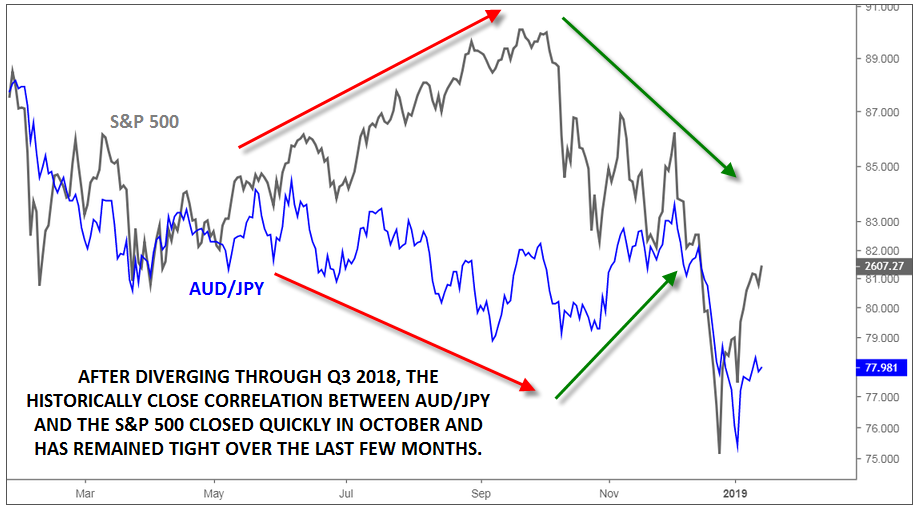
One of the first things that new traders to the FX markets learn is that many currencies are correlated with other markets. For instance, the close relationship between oil and the Canadian dollar or certain metals and the Australian dollar are intuitive given the importance of exporting those commodities for the Canadian and Australian economies.
One strong, but less obvious, correlation is the tight connection between AUD/JPY and global stock markets. In this case, the factor linking the two seemingly disparate markets is investors’ risk appetite. When market participants are feeling optimistic about global economic growth, they tend to buy stocks at the expense of more conservative investments such as bonds.
A similar dynamic takes place in the FX market, where upbeat traders will buy higher-yielding currencies with underlying economies leveraged to global economic growth (e.g. the Australian and New Zealand dollars) and sell lower-yielding currencies with relatively stable economies (e.g. the Japanese yen and Swiss franc). Conversely, when traders are apprehensive about the potential for global economic growth, they tend to unwind those trades by selling the higher-yielding currencies and buying perceived safe havens. This is the essence of the so-called “carry trade,” a major short- and long-term driver of FX movements.
This strong correlation offers traders several actionable insights. Most straightforwardly, if a trader feels strongly that the broad stock market is due to fall or rise, he/she could use AUD/JPY to express that view in a highly liquid, 24-hour market that offers the potential for leverage. Alternatively, traders can watch for divergences between the S&P 500 and AUD/JPY as a sign that one (or both) of the markets is vulnerable to a reversal.
We saw that exact scenario in Q3 2018, when the S&P 500 rallied to new highs, while AUD/JPY continued to languish. The divergence indicated that stock traders should be more skeptical toward the rally in the S&P 500 and sure enough, the index unwound months’ worth of gains in a couple of weeks in October. Such divergences can emerge over longer time horizons yet given the upward tendency of stock investments, they can still provide valuable signals to short-term and swing traders.

Source: TradingView, FOREX.com
Cheers
