For all the talk of stimulus and helicopter money overnight and the general shift to “risk on” assets everywhere, Asia has had a decided profit taking look about it across the board as the APAC morning has gone on today. Stock markets across the region are all lower with the Nikkei a standout at -1.30% down as I write. More on this later… On the currency front, USD/JPY has followed the Nikkei lower as extra budget euphoria takes a rest with the 104.00 area intra-day support. Weaker Westpac Consumer Confidence and some semi-dovish inflation comments from the RBNZ have seen both AUD and NZD trade near the bottom of their daily ranges. NZD, in particular, is hovering above intraday support at 7255/60 the 100-hour moving average and hourly Ichimoko cloud.
Sometimes its good to step back from all the noise, and be the “voice of reason.” With the frenzied flip to “risk on” this week one cross, in particular, has caught my cautionary eye. The world’s favourite carry trade, long AUD/JPY.
Firstly let’s deal with Japanese extra budget. We now know it is coming but we don’t know is just how much. Numbers of between JPY10 trillion and JPY20 trillion have been mooted. Impressive indeed, however, the Japanese Government is committed to achieving a fiscal surplus by 2020. I am personally struggling to see how a stimulus of this size can be consistent with that without issuing a lot more debt that the BoJ will have to buy.
As my colleague, Stephen Innes, said this morning, the street may have got ahead of itself and the potential for disappointment on a lower package size is increasing.
Secondly market positioning in the short term. Looking at Oanda’s long-short ratios the no 1 and no 4 long over short positions are AUD/JPY and USD/JPY.
![]()
![]()
My less than perfect skills with Word Press aside, we can see that short term positioning in both AUD/JPY and USD/JPY is very much on the extended side. This again could possibly lead to the downside being vulnerable should the stimulus package disappoint or indeed, from any “risk off” news. See all of the long short ratios here. Oanda Long/Short Position Ratios.
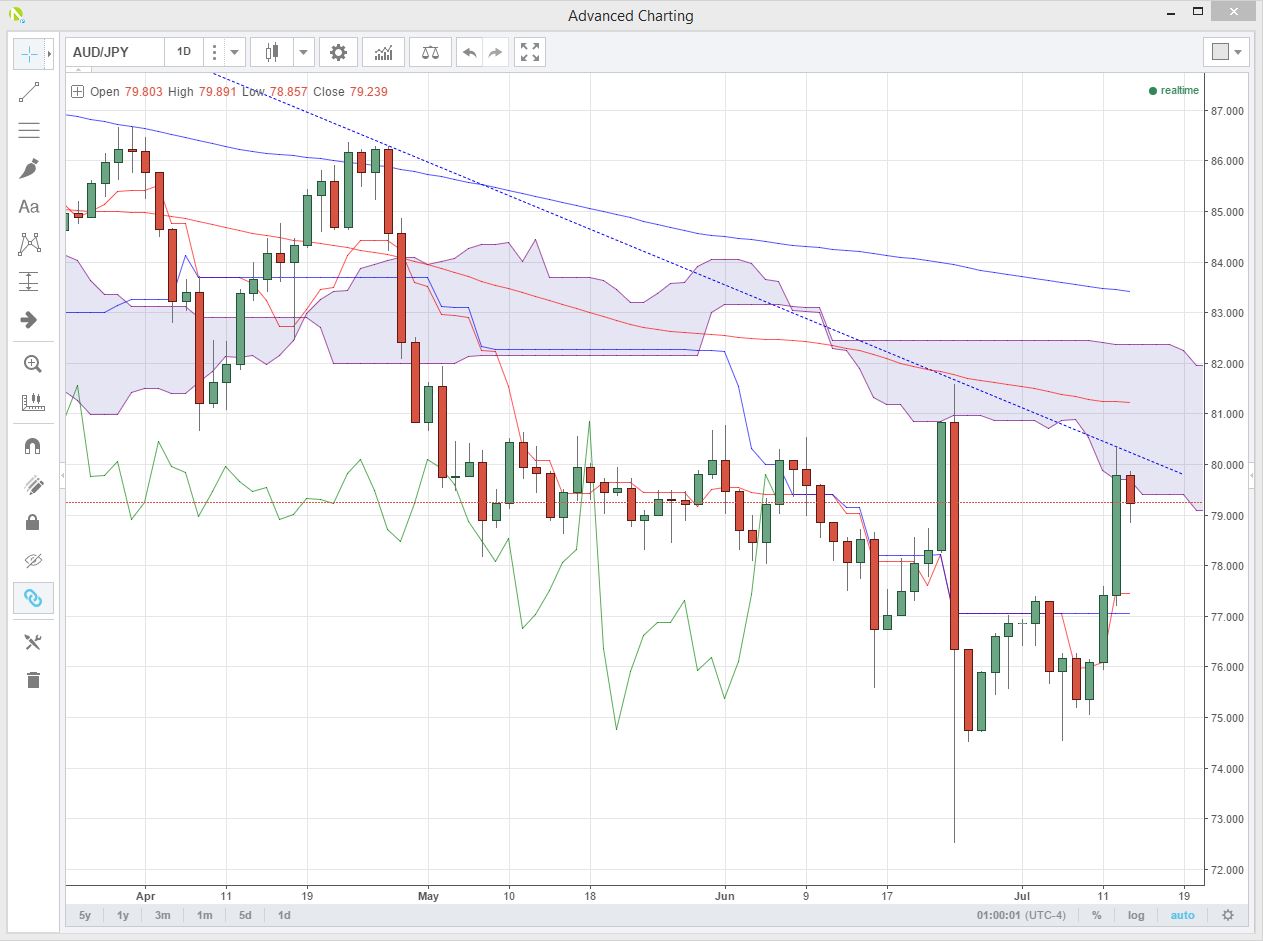
Thirdly, looking at the AUD/JPY daily chart below, there are a number of significant technical resistances above and over the new few big figures. Notably,
79.75 Double top and the bottom of the daily ichimoko cloud
80.25 Trendline resistance going back to April
81.20 100 day moving average
82.40 Top of the daily ichimoko cloud
83.40 200 day moving average
DAILY AUD/JPY : source OANDA FX Trade Advanced Charting

I have always subscribed to the saying “the markets can remain irrational, longer than you can stay solvent.” In this case, I am not suggesting the street is wrong here. Merely that a confluence of factors, ie Japan fiscal constraints, short-term positioning, technical resistance are all combing to add some caution to the wildly exuberant “risk on” price action of the last few days.
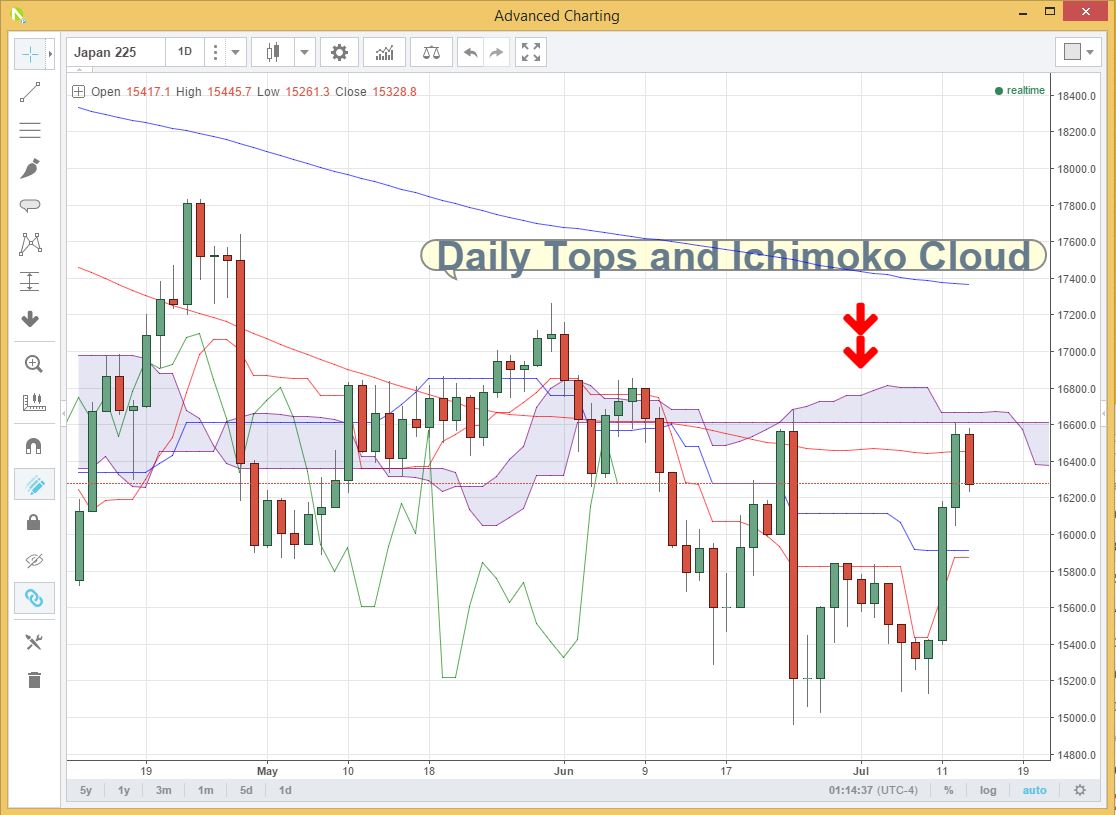
Finally and in the theme of the above I note significant resistance now on the Nikkei 225 after a storming run higher this week. As annotated on the chart, the Nikkei has a number of daily tops around 16600. This is also the base of the ichimoko cloud although it is quite thin at this level. The Nikkei has tested and failed here. It is in danger of having a reversal day if we see a close below the 100 day moving average at 16450. (the red line) A daily close above the cloud should open up a run at the 200 day moving average at 17400.

