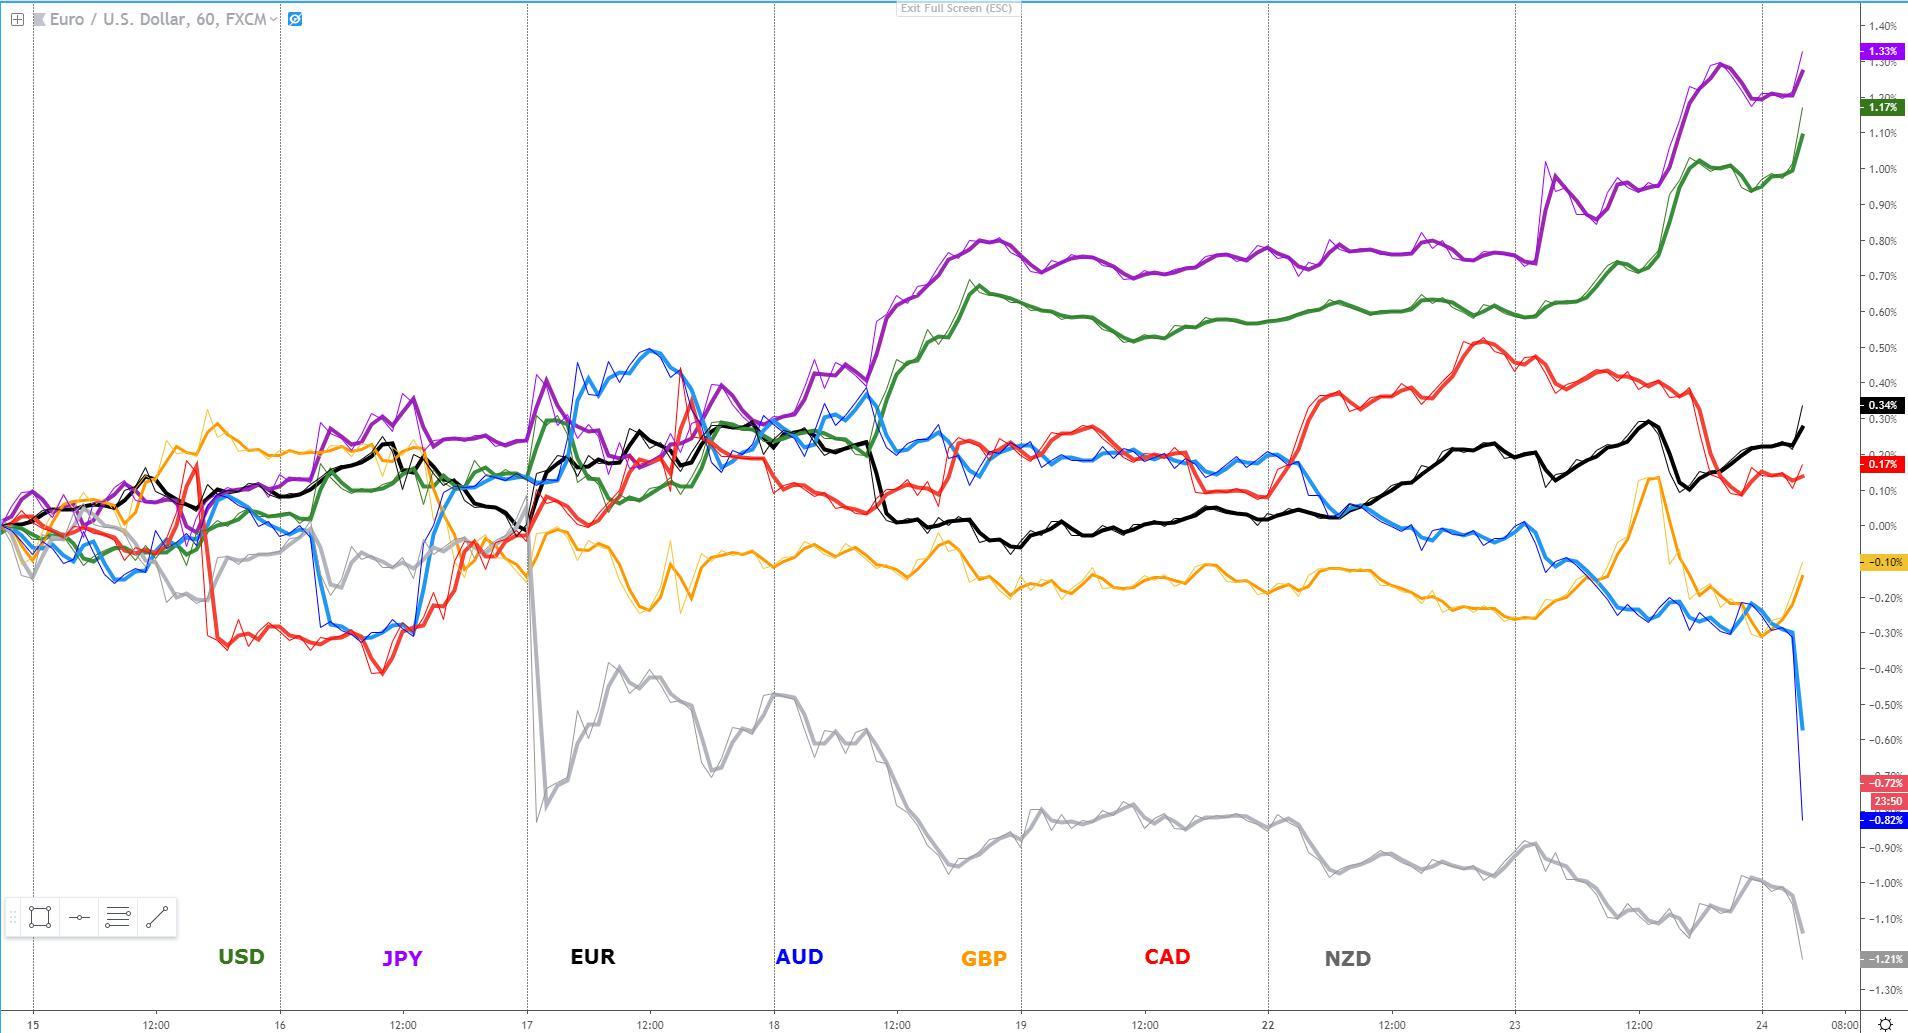
The USD is on a tear, rising against all its G10 FX peers, while the Japanese yen, surprisingly, follows the former in locksteps, disregarding the new record high on the S&P 500 (on a closing basis). Another currency that is defying Intermarket logic, at least on Tuesday, is the Canadian dollar, initially boosted by oil prices right off the bat post-Easter, but unable to hold onto its most recent gains as commodity take a beating. Talking about the commodity complex, the Aussie, and to a much lesser extent the Kiwi, was knocked down aggressively after we learned that Australian inflationary pressures are nowhere to be found; the annual CPI reading was the weakest on record! Lastly, we find a rather stable EUR and GBP currency indices, even if it'd be hard to believe by checking the EUR/USD or EUR/JPY charts. The demand flows towards the USD and JPY have been so strong (resumption of repatriation flows?), that the rest of G10 FX currencies, even if showing stability on an equally-weighted basis, were overwhelmed against the formers.
Narratives In Financial Markets
- The S&P 500, as the bellwether of US equities, conquers yet another milestone by closing at all-time highs after a +0.8% gain as a fresh raft of companies beat estimates.
- Oil surged past the $66 mark earlier on the week as the US ends the waivers for nations buying Iranian Oil, which is likely to create supply disruptions. Another line of thinking, which may explain the inability of Oil to extend its gains today, is that OPEC+ members may step up production to make up for the void by the decrease in Iranian Oil exports.
- The USD exhibited fortitude against its G10 peers as the DXY soars to its highest intraday level since late June last year as the preponderance of evidence continues to suggest the US economy is roaring ahead judging by the upbeats in company earnings during this Q1 earnings season. The strength in the USD has been accompanied by across the board appreciation in the Japanese yen, an anomaly based on
- the dynamics of surging equities.
- The Bank of Canada monetary policy meeting is the next critical mover for the CAD, due at 14 GMT on Wednesday. Current market expectations are not as dovish as they are for the Fed, with about an 18% chance of a cut this year as opposed to 56% for the Fed. If BoC Governor Poloz tilts the balance towards the dovish side and removes any residual hawkishness, there is definitely room for the CAD to depreciate considerably. For today’s meeting, it will include a fresh round of quarterly forecasts in monetary policy reports, which only adds to the incentives for volatility to explode around the time of the event.
- It’s important to be reminded that last Friday, The Politburo – China’s ruling body headed by President Xi – reviewed China's growth path and came to the conclusion that is no longer necessary to be as aggressive in their “six stabilisations” pillars (stabilisation in employment, finance, trade, foreign investment, investment and expectations), suggesting that while pro-growth policies are here to stay, the PBoC appears to be growing more comfortable with the set of measures introduced since last year to stimulate the economy. It helps explains the headline by Reuters that the PBOC is likely to refrain from further RRR cuts.
- The more headlines about a tentative agreement between US-China on a trade deal, the more evidence we can gather, based on the muted market reaction, that a deal is fully priced in. On Wednesday, it was the turn of US Economic Advisor Kudlow, who said “we’ve gotten closer to a deal’, yet the market barely budget on the headlines, hence reinforcing the notion that when the actual deal does come forward and it’s official, the risk of a ‘sell the fact’ should be considered.
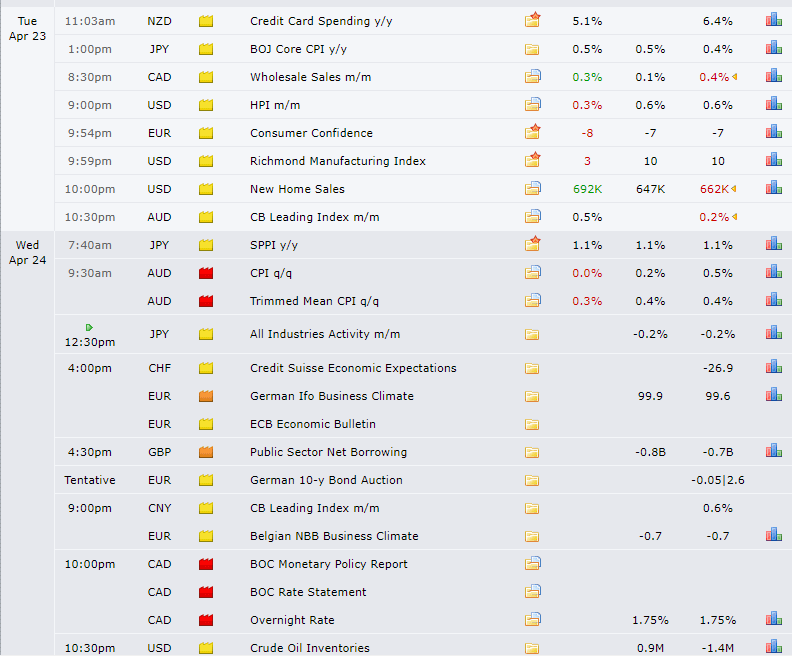
- The Australian CPI readings came lower-than-expected in the March quarter, which implies the odds the RBA cutting interest rates in the months ahead just went up considerably. Aussie Q1 headline came at 0% vs 0.2% exp and 0.5% prior, while the y/y was 1.3% vs 1.5% exp and 1.8% prior. The RBA trimmed mean stood at 0.3% q/q vs 0.4% exp and 1.6% y/y vs 1.7% exp. We've seen a major selloff in Australian rates, where the 3-year fell towards 1.30% from levels near 1.4%. The market is now pricing in over 12bp of rate cuts by the RBA in its June meeting. This is the lowest annual increase in prices on record.
Recent Economic Indicators & Events Ahead
Source: Forexfactory
RORO (Risk On, Risk Off Conditions)
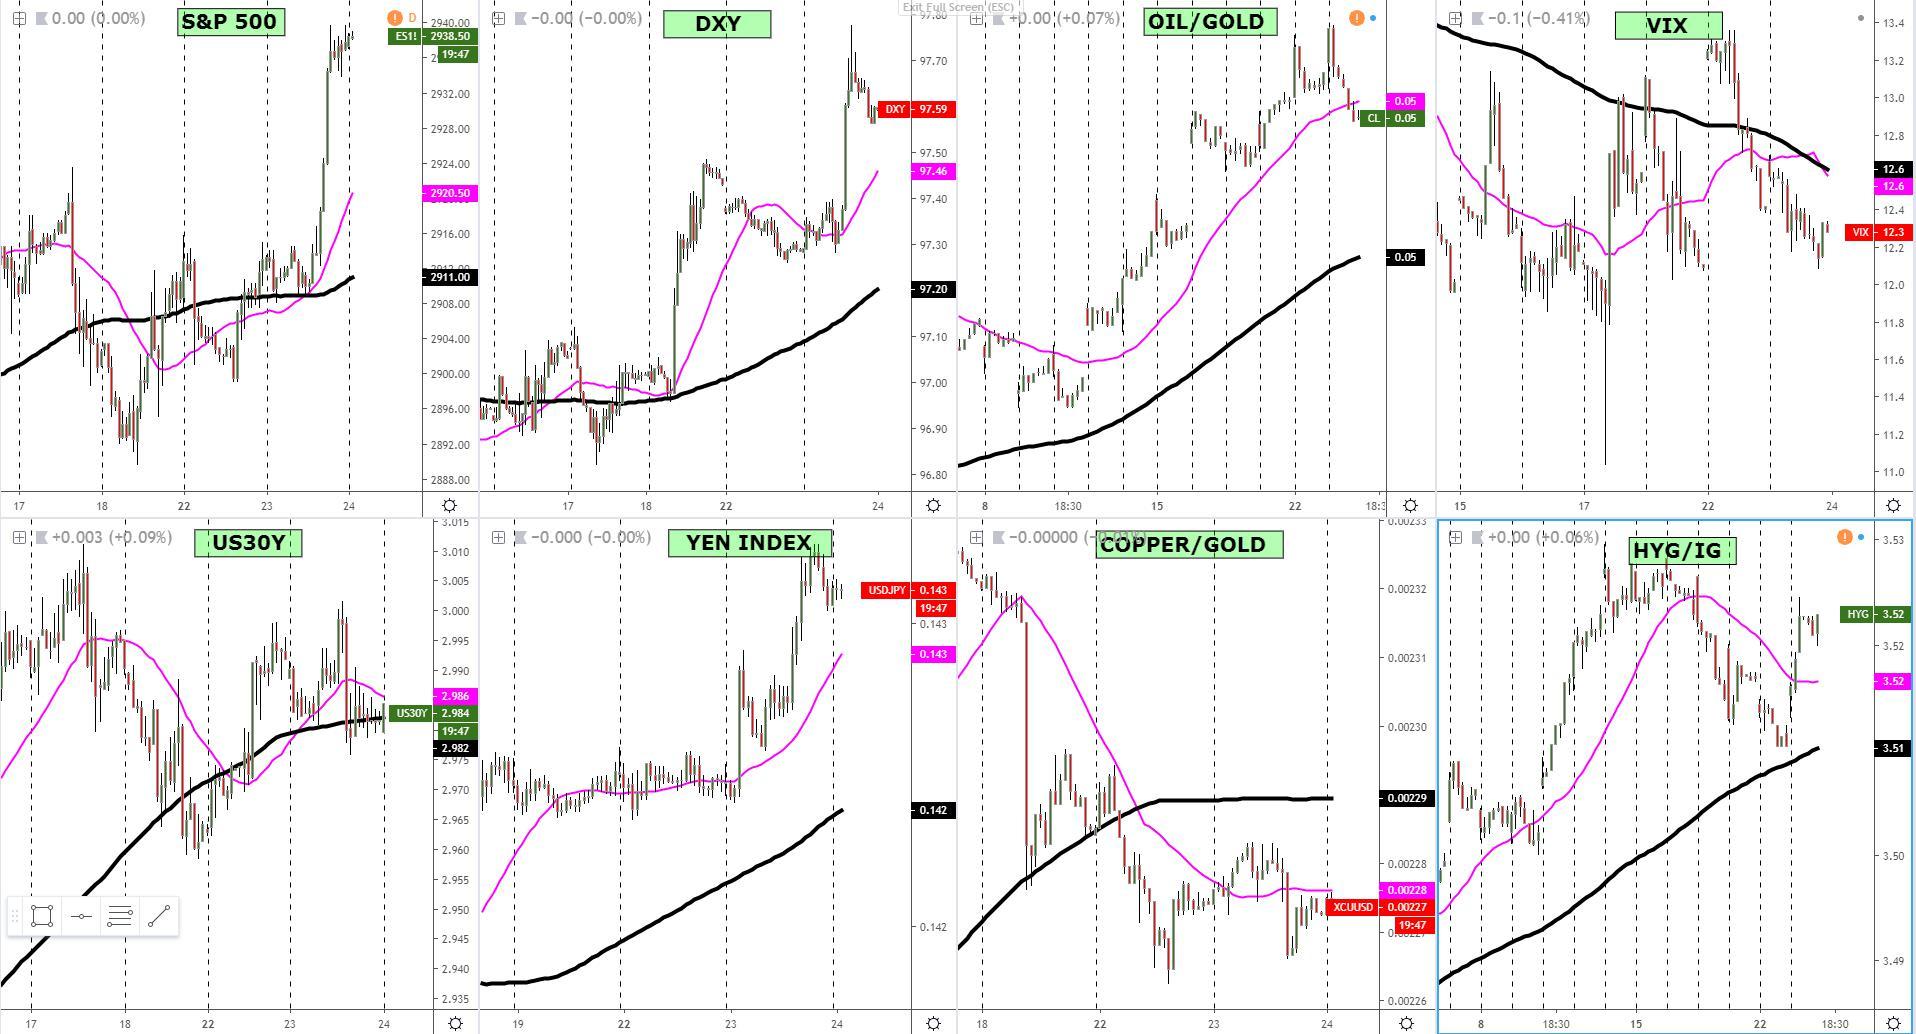
An anomaly is underway, one that involves a surging S&P 500 (closed on a new record high), yet the yen and the DXY index both underperformed the rest of the G10 FX space. The strength in the latter can be predicated on the stubbornness of the US economy, on track to print a solid advance US GDP number later this week as evidence of its robust health mounts (last week’s strong increase in US retail sales, reduction in US trade deficit, upbeat earnings…). If we combined these US-centric positive catalysts with news that China may be setting the bar higher to ease further, alongside the fact that US equities are making headlines by breaking into new record highs, we might be going through yet another episode of aggressive repatriation of USDs back into the US economy. Remember, the gap between the US economy and the RoW (rest of the world) appears to be widening in favor of the latter. With the exception of China, the general perception is that global manufacturing and export growth remains weak, including key regions that act as barometers such as South Korea, Singapore, not to mention the depressed state in the EU. Shifting gears now, making sense of the spike in the yen index is more complicated, and my view is that such strong gains are unsustainable much longer, in other words, the yen is looking rather cheap at present levels. Be reminded, credit markets in the US have seen junk bonds aggressively bought, as well as the VIX coming down, both signaling congruences for the risk rally in equities to continue charging higher.
Latest Key Technical Developments In G8 FX
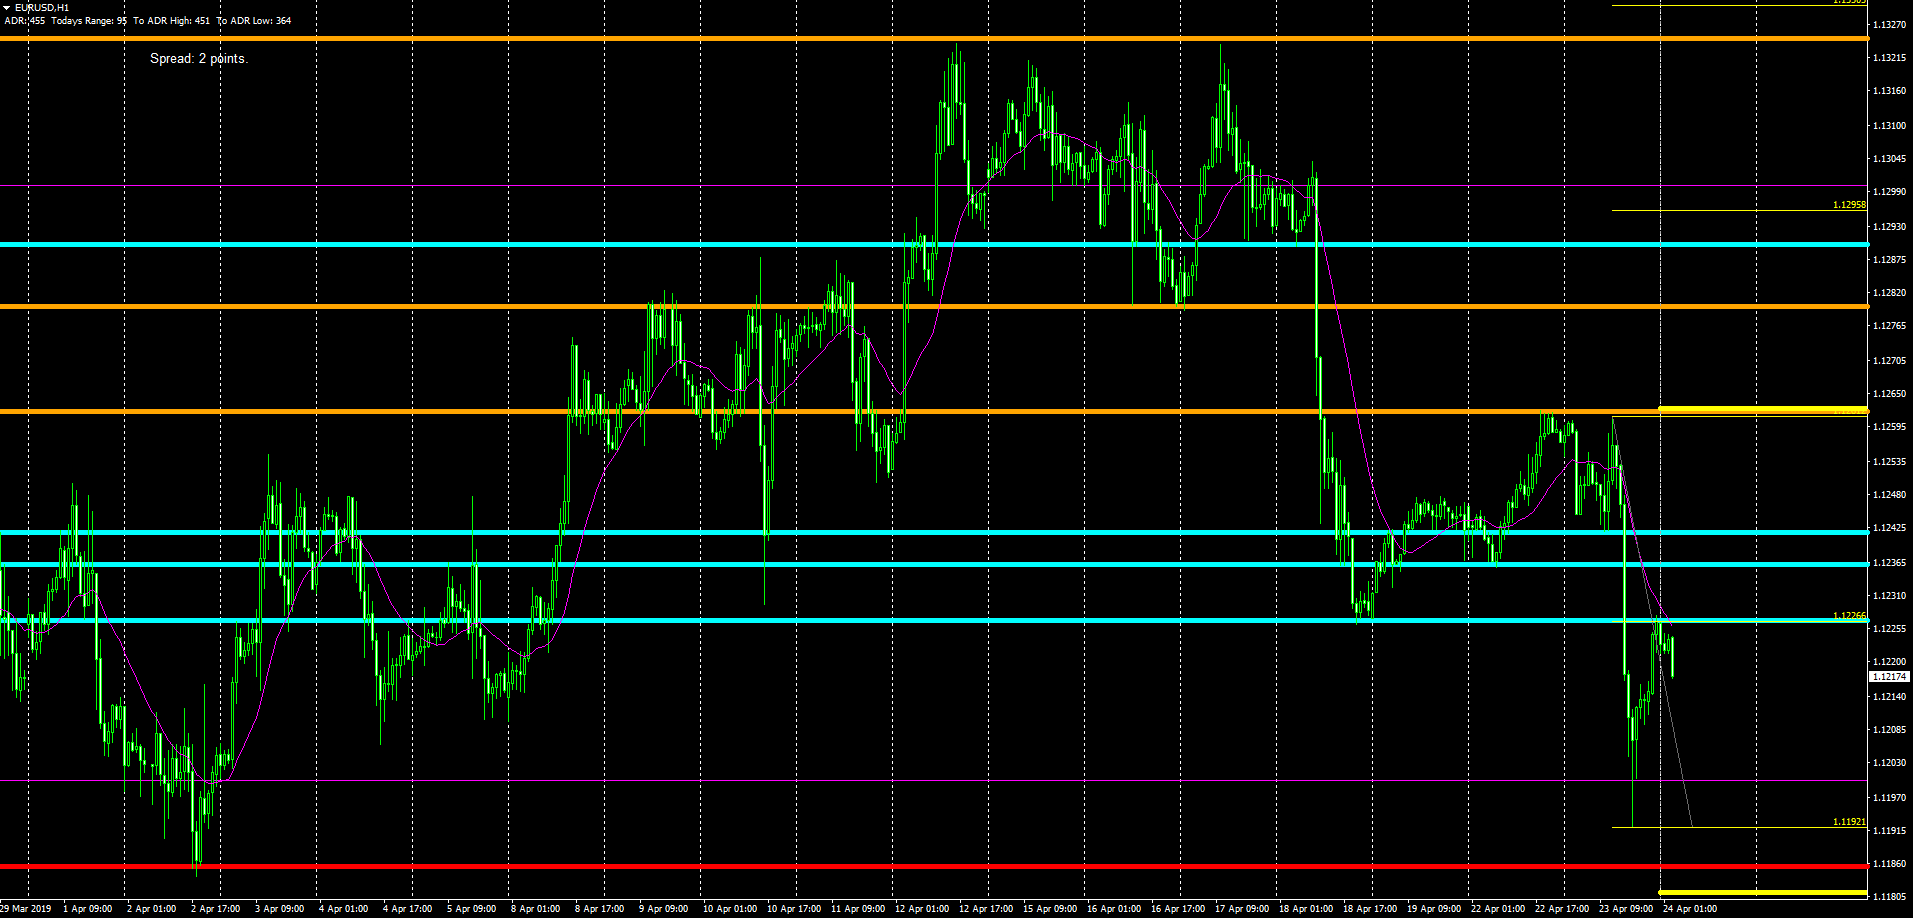
EUR/USD: Sell-Side Confluence At 1.1225
The aggressive selloff in the exchange rate is likely to draw strong selling interest, starting from 1.1225, where an hourly horizontal resistance level meets a set of confluences. Not only the 50% fib retracement of the latest decline crosses at the same level but we also can spot the intersection of the 25-HMA, which keeps its slope with a pronounced downward angle, reflecting the decisive bearish momentum that exists in this market. Even in terms of market structure, Tuesday’s down leg represents the 2nd cycle down out of what’s expected to be a 3 push down given the magnitude and speed of the movements seen during the first and second bearish phases. Besides, notice that the EUR supply imbalance terminated, as I tend to always promote, at the 100% projected target.
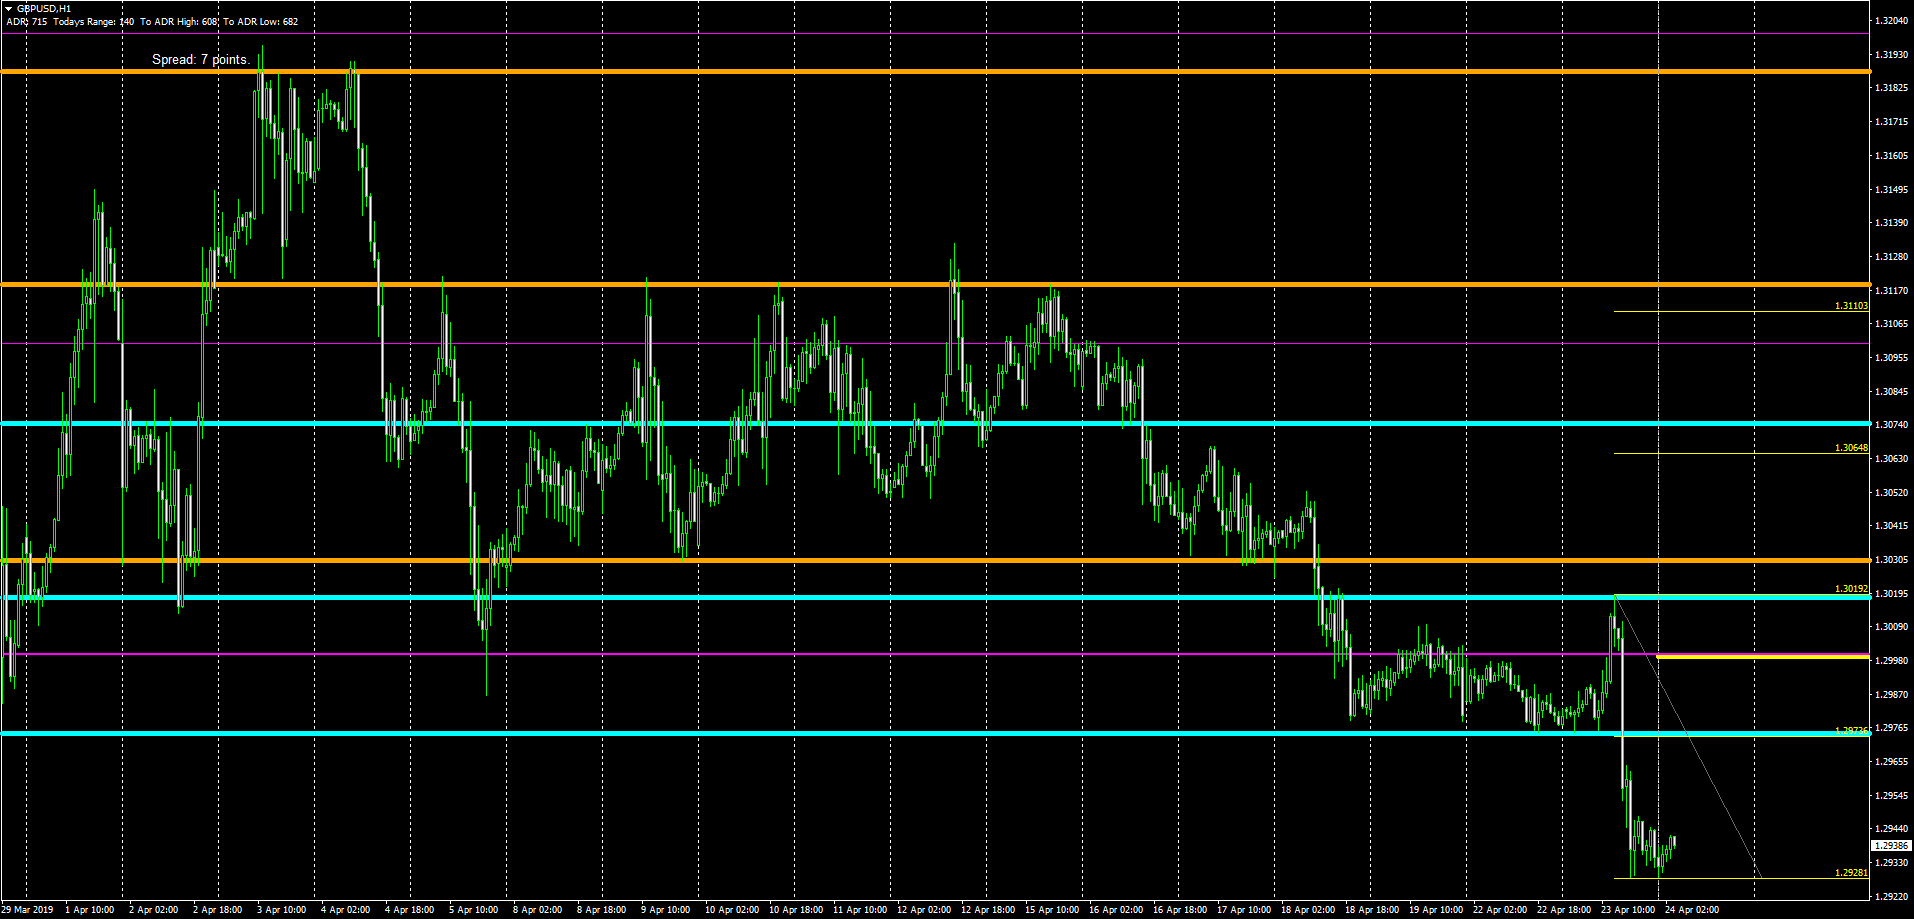
GBP/USD: Sellers Reach Projected Target (NYSE:TGT)
The sell-side campaign initiated out of a head fake above 1.30 has reached its 100% projected target at 1.2928, an area where I am expecting market makers and a multitude of other account types to try to engineer a short-term reversal back to the mean. That mean, in my opinion, should find its ultimate limit up circa 1.2975-80, where the 50% fibonacci retracement of the latest selloff comes at, aligning perfectly with an old area of support-turned-resistance. One wishes the sterling would trade more often in line with technicals, but the reality of Brexit headlines will soon sink in again, even if the pressure to deliver a deal in the immediate future is now off the table, so one would think the risk of GBP moving headlines may have been downgraded a tad in coming weeks.
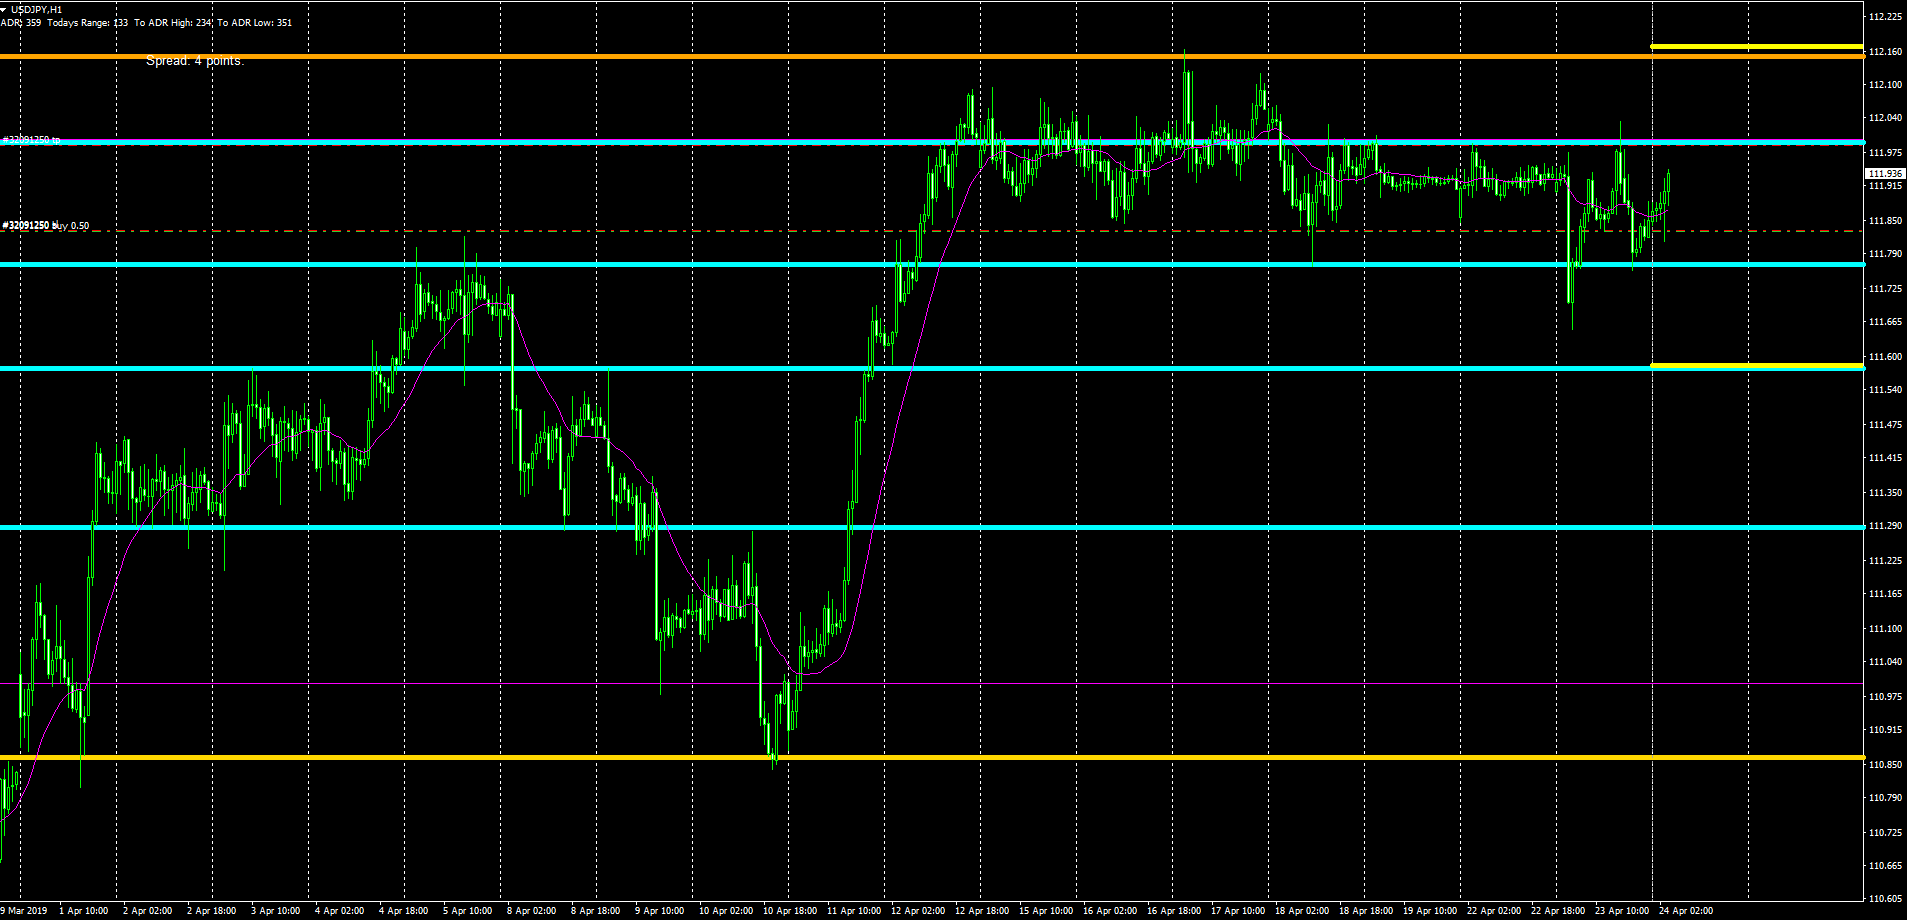
USD/JPY: Sellers Abound Around the 112.00 Area
For the Japanese yen to be one of the outperformers as the S&P 500 closes at an all-time high, one has got to assume a high degree of interest to buy the currency around 112.00, a level that has been consistently rejected for over 2 weeks now. What this means is that a huge pool of liquidity is building up above market prices, and with the S&P 500 soaring and the US30y rather stable, the price discovery dynamics should continue to be skewed towards the upside, hence a strategy of buying on weakness seems to still be well justified for a retest of 112.00 and beyond. The way I interpret the 2-week long consolidation on the pair is a market in agreement to find equilibrium at higher prices, which tends to be the precursor for higher levels in line with the macro bullish trend.
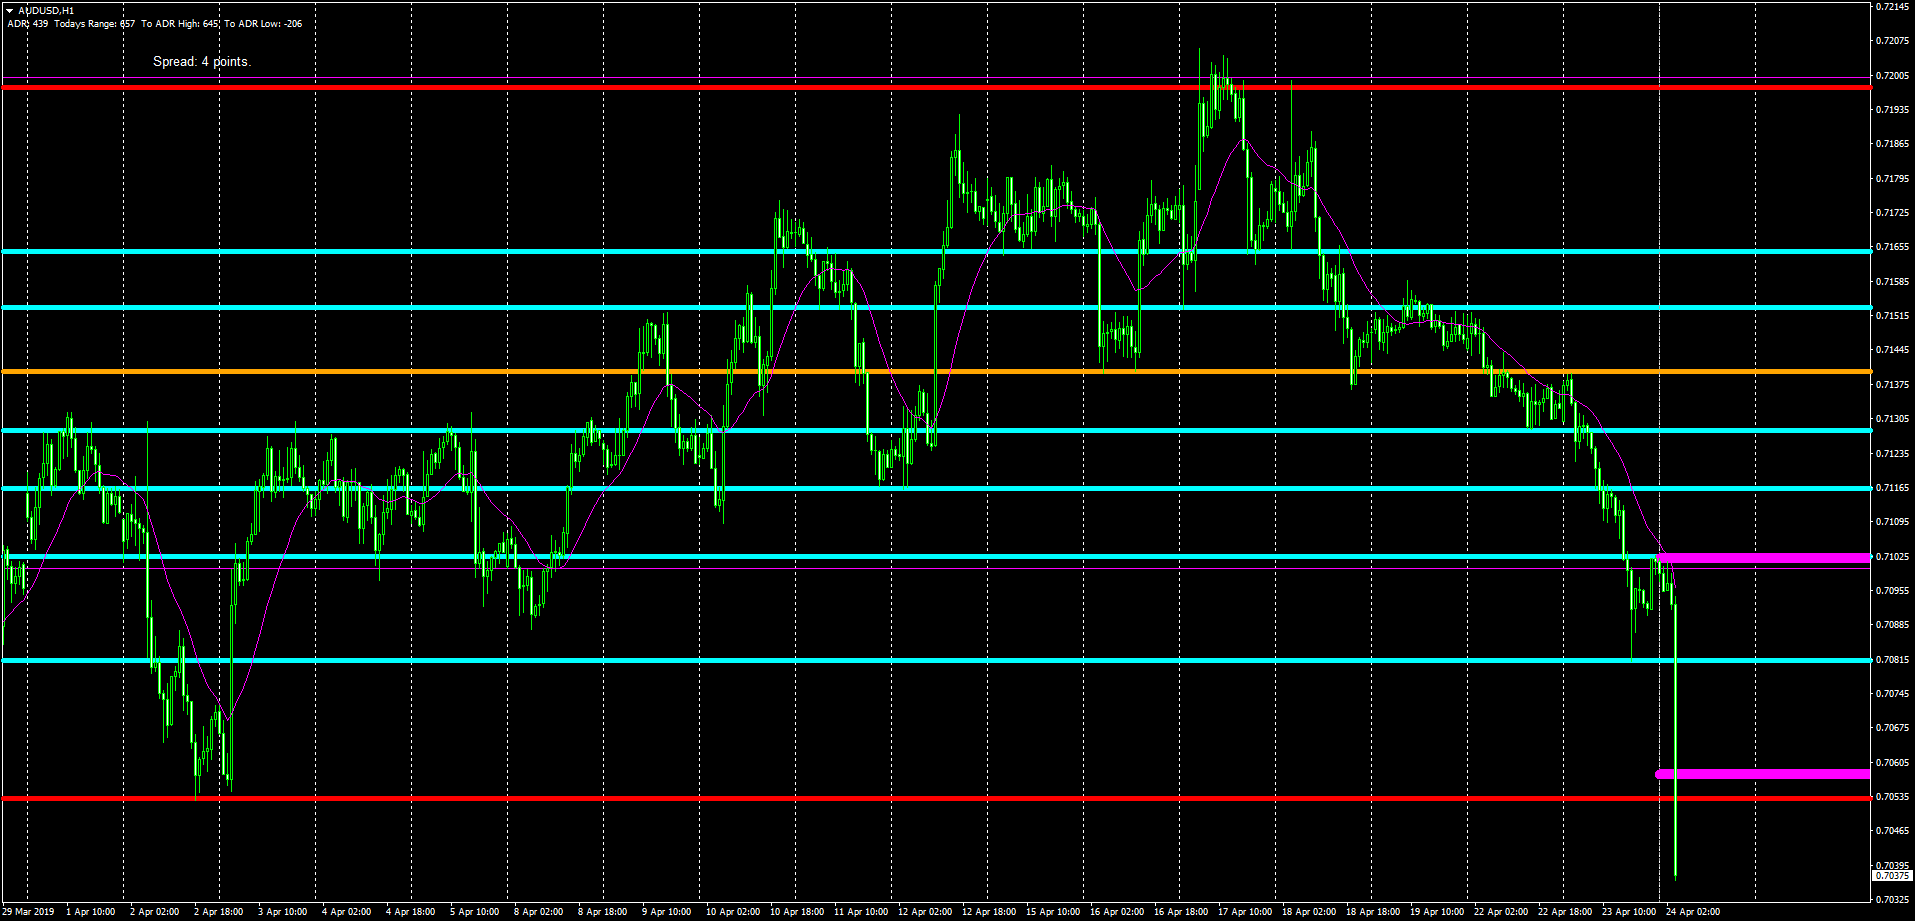
AUD/USD: Hammered After Lowest Annual CPI On Record
The downbeat Australian CPI is likely to draw further selling interest towards the Australian dollar in days to come, even if today's move appears to be quite overdone as the exchange rate has surpassed by a decent chunk its daily ATR. Expect a slow bleed lower for the rest of the day as the market ups the odds of a rate cut by the RBA in coming months. The June meeting has implied pricing of -12bp, which essentially means a 50/50 show vs a mere -5bp prior to the event. The exchange rate is fast approaching a major macro level at 0.70c, which should attract buying interest. When the NZ CPI missed its CPI inflation expectations 2 weeks ago, the sell-side campaign by fast money, leveraged players and macro accounts went on for over a week. I wouldn't be surprised if the campaign to sell the Aussie were to perdure as long.
Important Footnotes
- Risk model: The fact that financial markets have become so intertwined and dynamic makes it essential to stay constantly in tune with market conditions and adapt to new environments. This prop model will assist you to gauge the context that you are trading so that you can significantly reduce the downside risks. To understand the principles applied in the assessment of this model, refer to the tutorial How to Unpack Risk Sentiment Profiles
- Cycles: Markets evolve in cycles followed by a period of distribution and/or accumulation. The weekly cycles are highlighted in red, blue refers to the daily, while the black lines represent the hourly cycles. To understand the principles applied in the assessment of cycles, refer to the tutorial How To Read Market Structures In Forex
- POC: It refers to the point of control. It represents the areas of most interest by trading volume and should act as walls of bids/offers that may result in price reversals. The volume profile analysis tracks trading activity over a specified time period at specified price levels. The study reveals the constant evolution of the market auction process. If you wish to find out more about the importance of the POC, refer to the tutorial How to Read Volume Profile Structures
- Tick Volume: Price updates activity provides great insights into the actual buy or sell-side commitment to be engaged into a specific directional movement. Studies validate that price updates (tick volume) are highly correlated to actual traded volume, with the correlation being very high, when looking at hourly data. If you wish to find out more about the importance tick volume, refer to the tutorial on Why Is Tick Volume Important To Monitor?
- Horizontal Support/Resistance: Unlike levels of dynamic support or resistance or more subjective measurements such as fibonacci retracements, pivot points, trendlines, or other forms of reactive areas, the horizontal lines of support and resistance are universal concepts used by the majority of market participants. It, therefore, makes the areas the most widely followed and relevant to monitor. The Ultimate Guide To Identify Areas Of High Interest In Any Market
- Trendlines: Besides the horizontal lines, trendlines are helpful as a visual representation of the trend. The trendlines are drawn respecting a series of rules that determine the validation of a new cycle being created. Therefore, these trendline drawn in the chart hinge to a certain interpretation of market structures.
- Correlations: Each forex pair has a series of highly correlated assets to assess valuations. This type of study is called inter-market analysis and it involves scoping out anomalies in the ever-evolving global interconnectivity between equities, bonds, currencies, and commodities. If you would like to understand more about this concept, refer to the tutorial How Divergence In Correlated Assets Can Help You Add An Edge.
- Fundamentals: It’s important to highlight that the daily market outlook provided in this report is subject to the impact of the fundamental news. Any unexpected news may cause the price to behave erratically in the short term.
- Projection Targets: The usefulness of the 100% projection resides in the symmetry and harmonic relationships of market cycles. By drawing a 100% projection, you can anticipate the area in the chart where some type of pause and potential reversals in price is likely to occur, due to 1. The side in control of the cycle takes profits 2. Counter-trend positions are added by contrarian players 3. These are price points where limit orders are set by market-makers. You can find out more by reading the tutorial on The Magical 100% Fibonacci Projection

