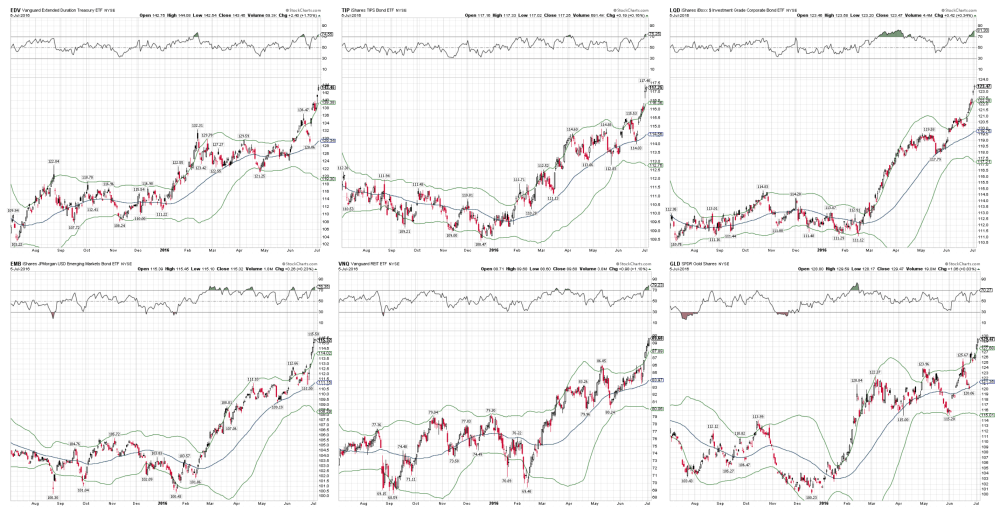
Just a quick technical update. It has come to my attention that variety of global macro asset classes have become overbought, over-extended and prone to a correction from both the short-term and medium-term perspective.
Market participants now believe that the Federal Reserve has all but given up on its rate hike intentions. Expectations from the bond pits show that the FOMC will stay on hold until 2018. With that context unfolding over the last few weeks, and Brexit adding fuel to the fire, various bonds—together with other interest rate sensitive assets—have benefited.
From a contrarian point of view, despite the fact that my portfolio has benefited tremendously, I now hold an opinion that we are about to mean revert.

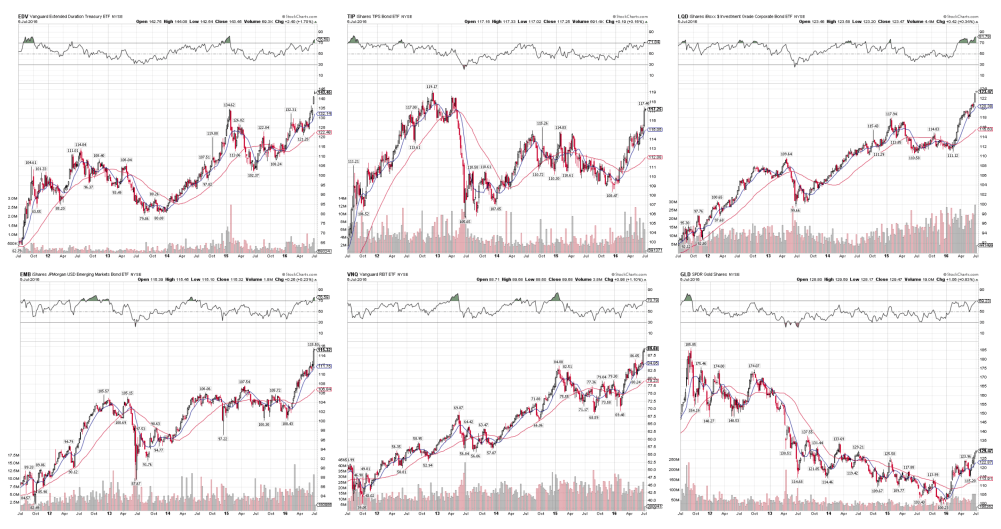
I’m going to keep the grid above, thanks to StockCharts.com website, in the same arrangement for both charts. Assets I am tracking here are all via ETF: Long Duration Treasuries (NYSE: NYSE:EDV), Treasury Inflation Bonds (NYSE:TIP), Investment Grade Bonds (NYSE:LQD), Emerging Market Bonds (NYSE:EMB), US Commercial Real Estate (NYSE:VNQ) and Gold (NYSE:GLD). To be quite honest, I could have added a few more asset class subsections such as the S&P 500 Dividends Aristocrat Index, S&P Utilities Index and so forth.
The first chart above is daily price (short term time frame). I am sure readers will be able to make plethora of savvy observations, but I will just make three simple ones:
- Every single asset is at least 2 standard deviations above its 50 day Bollinger® band
- Every single asset has its relative strength index (RSI) above 70
- Every single asset has been gapping upward and lately, moving in vertical fashion

If we expend our time horizon with the second chart onto the weekly price (medium-term time frame), we can see even more evidence of overextended trends, which are ripe for a correction.
Firstly, several of these assets are up five, six or even seven weeks in a row. The prices are trading well above their respective 200 day moving averages. Weekly RSI readings are overbought (especially the Long Bond, Corporate Credit and EM Debt).
Finally, once again we have large gaps on the weekly chart, accompanied by heavy volume (look at ETFs such as TLT and EDV). I would advise readers to be very cautious when it comes to adding new capital towards the overall bond market, real estate and precious metals sectors. This warning would also extend to defensive sectors such as Utilities, Staples, Dividend and Minimum Volatility equity indices… all of which are overextended.

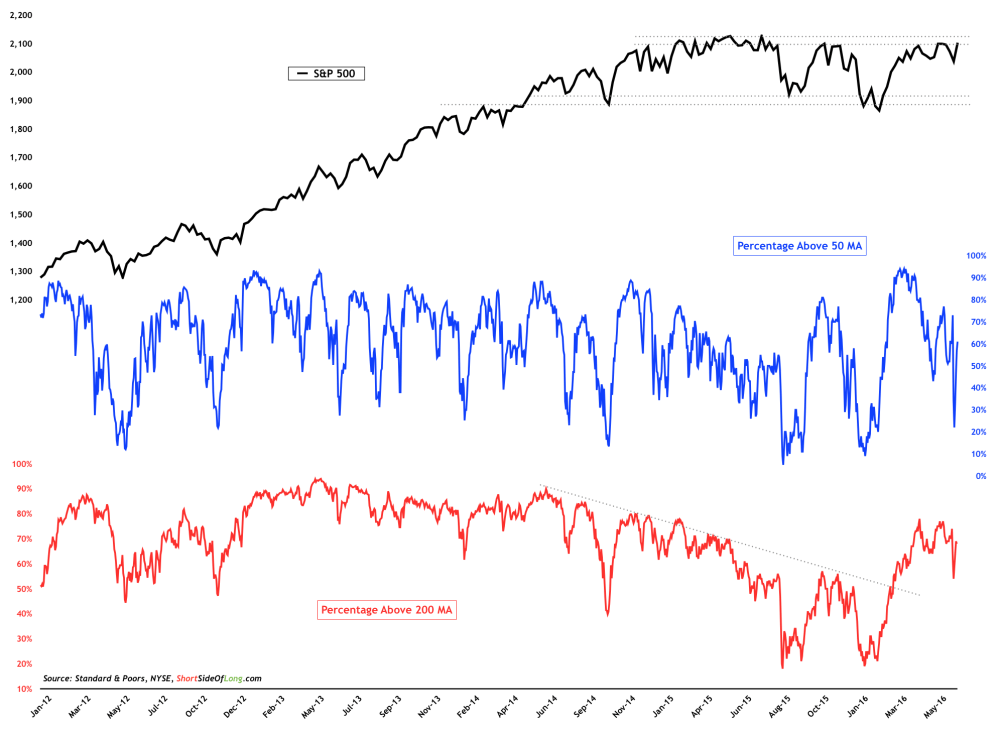
In my previous article, I discussed recent developments concerning the S&P 500 Index:
“On the topic of US resilience, what has me worried is an ugly technical reversal candle that occurred right at the resistance [S&P 500]. A decent short term support, as well as the 200 day moving average, are found around 2020 on this closely watched index. A breach of these levels, could signal further downside. Short term traders should pay close attention to S&P 500’s critical support level around 2020, and if breached could signal the continuation of the “risk off” trade. On the other hand, another sign of resilience by US equities right here will surely signal that new all time highs lay ahead.”
Here's yet another sign of resilience. The US index refuses to go down and Brexit selling was quickly reversed. US equities are having still another go at 2,100 to 2,120 resistance in an attempt to make new all-time highs (total return index has already achieved this). I’ll be watching price and breadth participation very closely.
