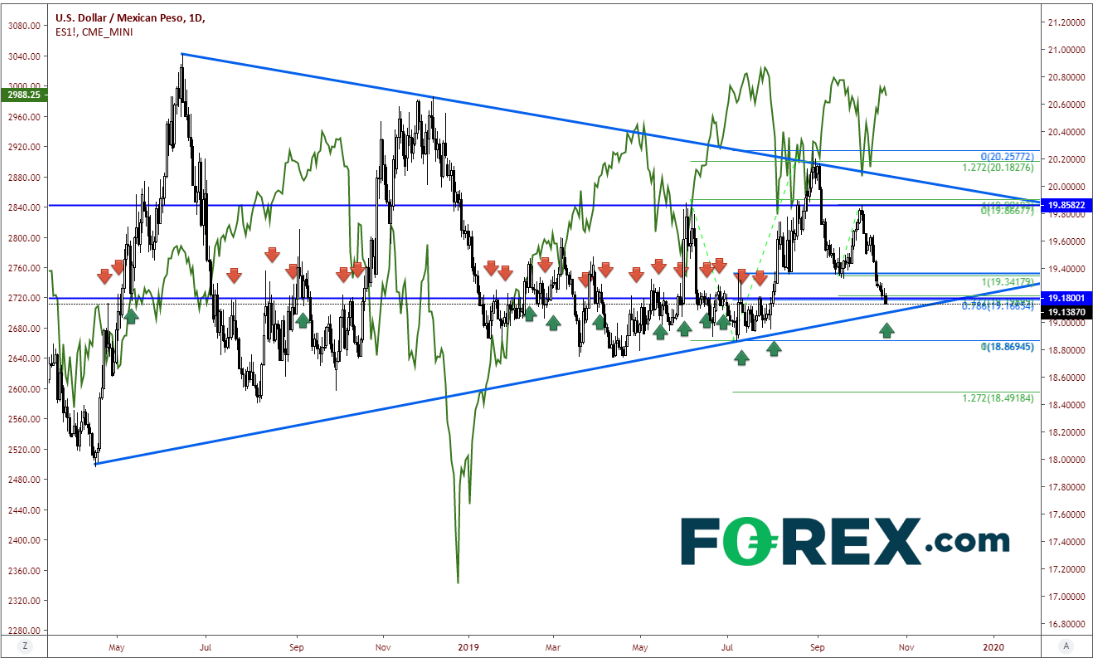
Ahead of the vote by UK Parliament on Brexit, most of the currency markets will be watching for headlines that will give them a better indication of which way the vote will swing. If the Brexit vote passes, stock indexes will most likely trade higher. If the vote fails, stock indexes are likely to trade lower. What does that mean for USD/MXN? Over time, the S&P 500 and USD/MXN are inversely correlated. As stocks trade higher, USD/MXN generally trades lower, and vice versa. Therefore, if the vote passes and stocks trade higher, USD/MXN is likely to trade lower. If the vote fails, stocks are likely to trade lower, and USD/MXN is likely to trade higher. The green line in the chart below is the S&P 500, which is plotted vs USD/MXN.

Source: Tradingview, FOREX.com, CME
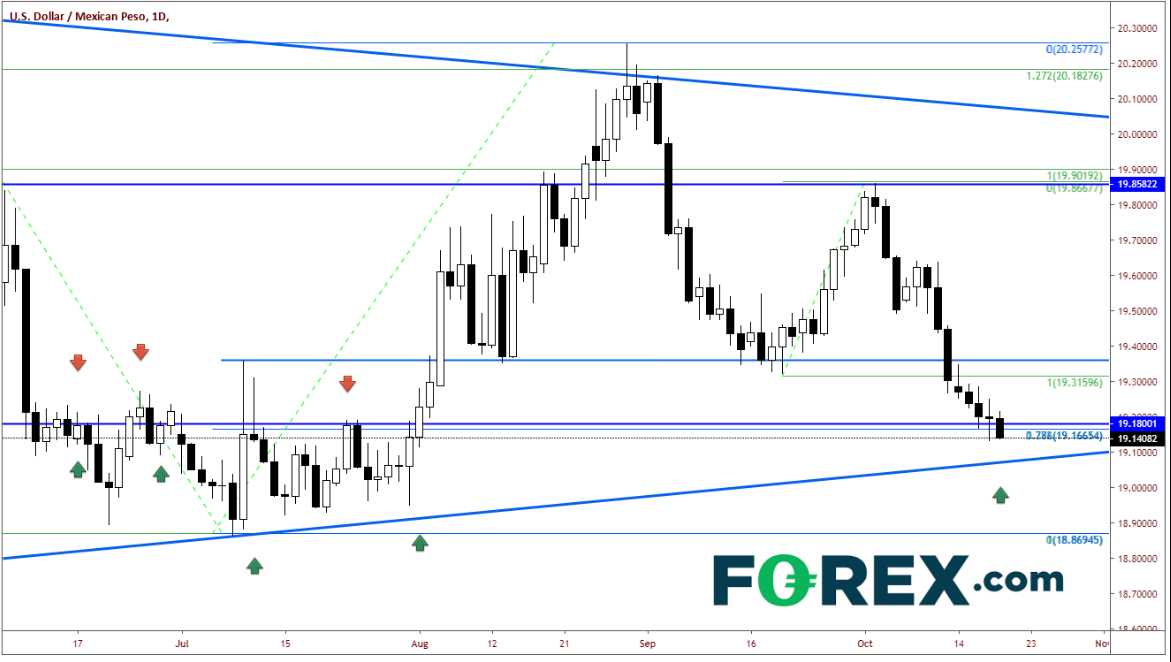
Notice how important of an inflection point the 19.18 level has been in the past for USD/MXN. It has traded around that level since the price has been trading in a symmetrical triangle from mid-April 2018. And here we are once again near that level. Not only is the area around 19.18 acting as a support zone right now, but there are a few other confluences of support in this area as well:
1. 19.65 is the 78.6% Fibonacci retracement from the lows on July 8th to the highs on August 29th
2. 19.65 is also coincidentally (or not) the 127.2% Fibonacci extension from the low on September 19th to the high on October 2nd.
3. Below here, near 19.07 is the rising trendline from the previously mentioned symmetrical triangle.

Source: Tradingview, FOREX.com
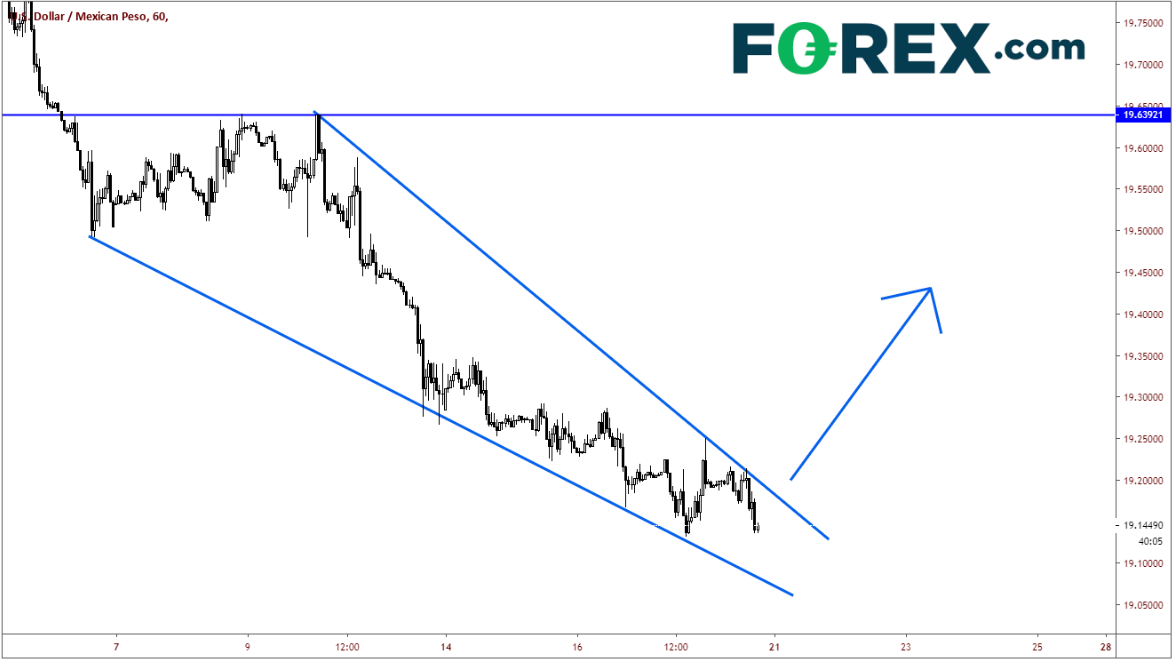
On a 60-minute time frame, USD/MNX is trading in a falling wedge formation. Typically, in a falling wedge, price will break out to the topside. The target for the breakout of a falling wedge is a 100% retracement of the wedge, which would target near 19.63.

Source: Tradingview, FOREX.com
Is the market positioning itself in USD/MXN for the Brexit vote to fail? Probably not. But one must be leery of how the Brexit vote will have ripple effects across other currency pairs, not just Euro and Sterling pairs.
