This article was written exclusively for Investing.com
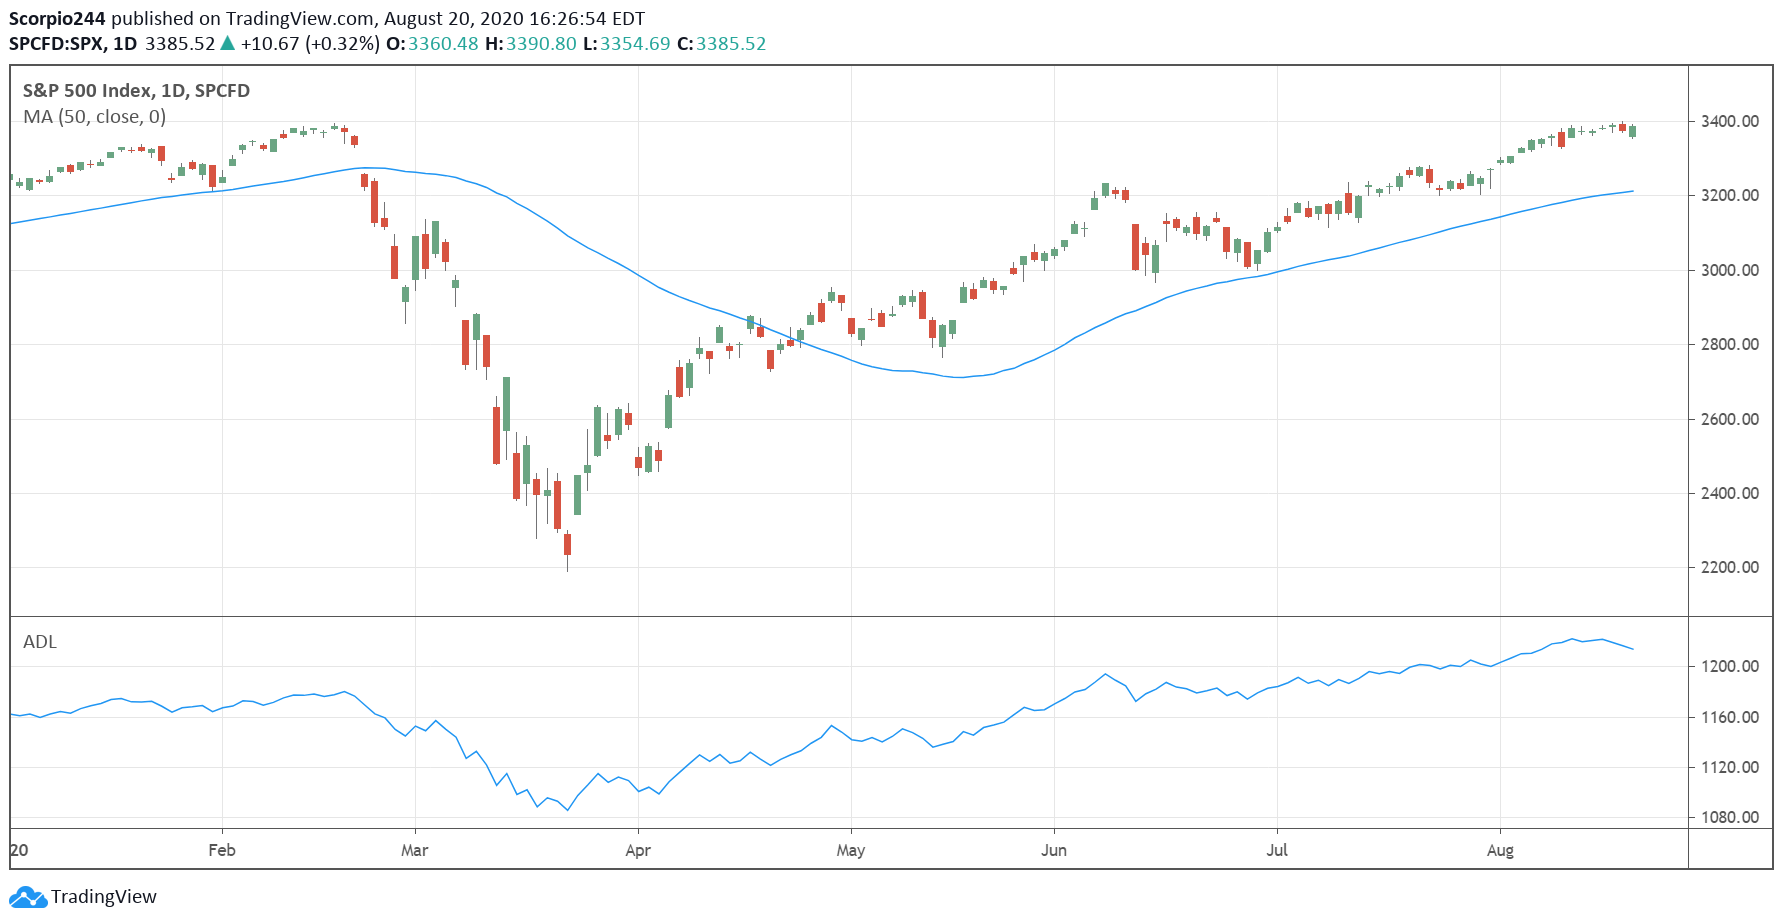
The S&P 500 advanced to a record close on Aug. 18, completely erasing the March sell-off. But, despite the appearance of a healthy stock market, trouble looms beneath the surface.
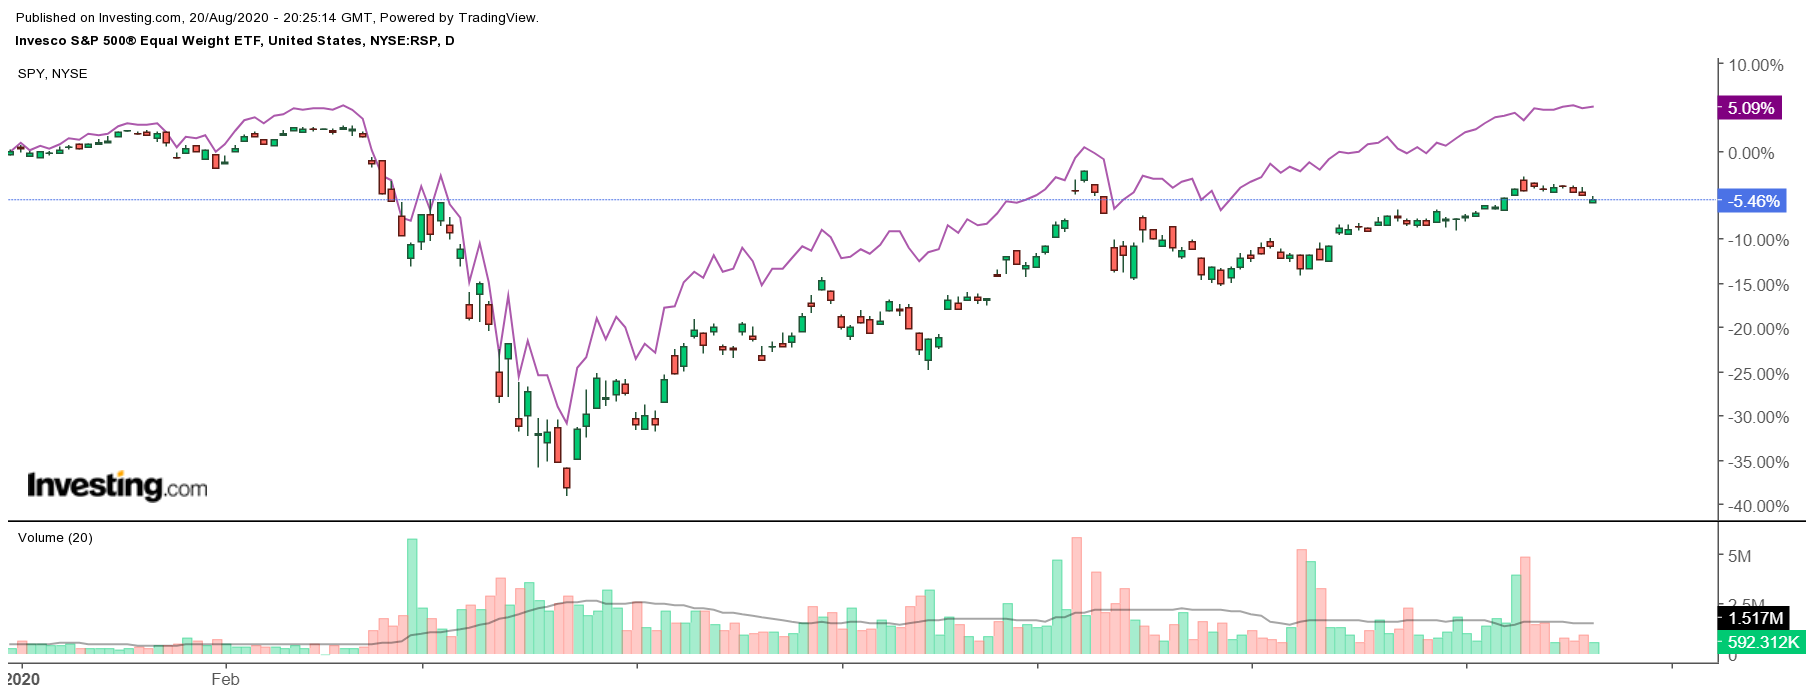
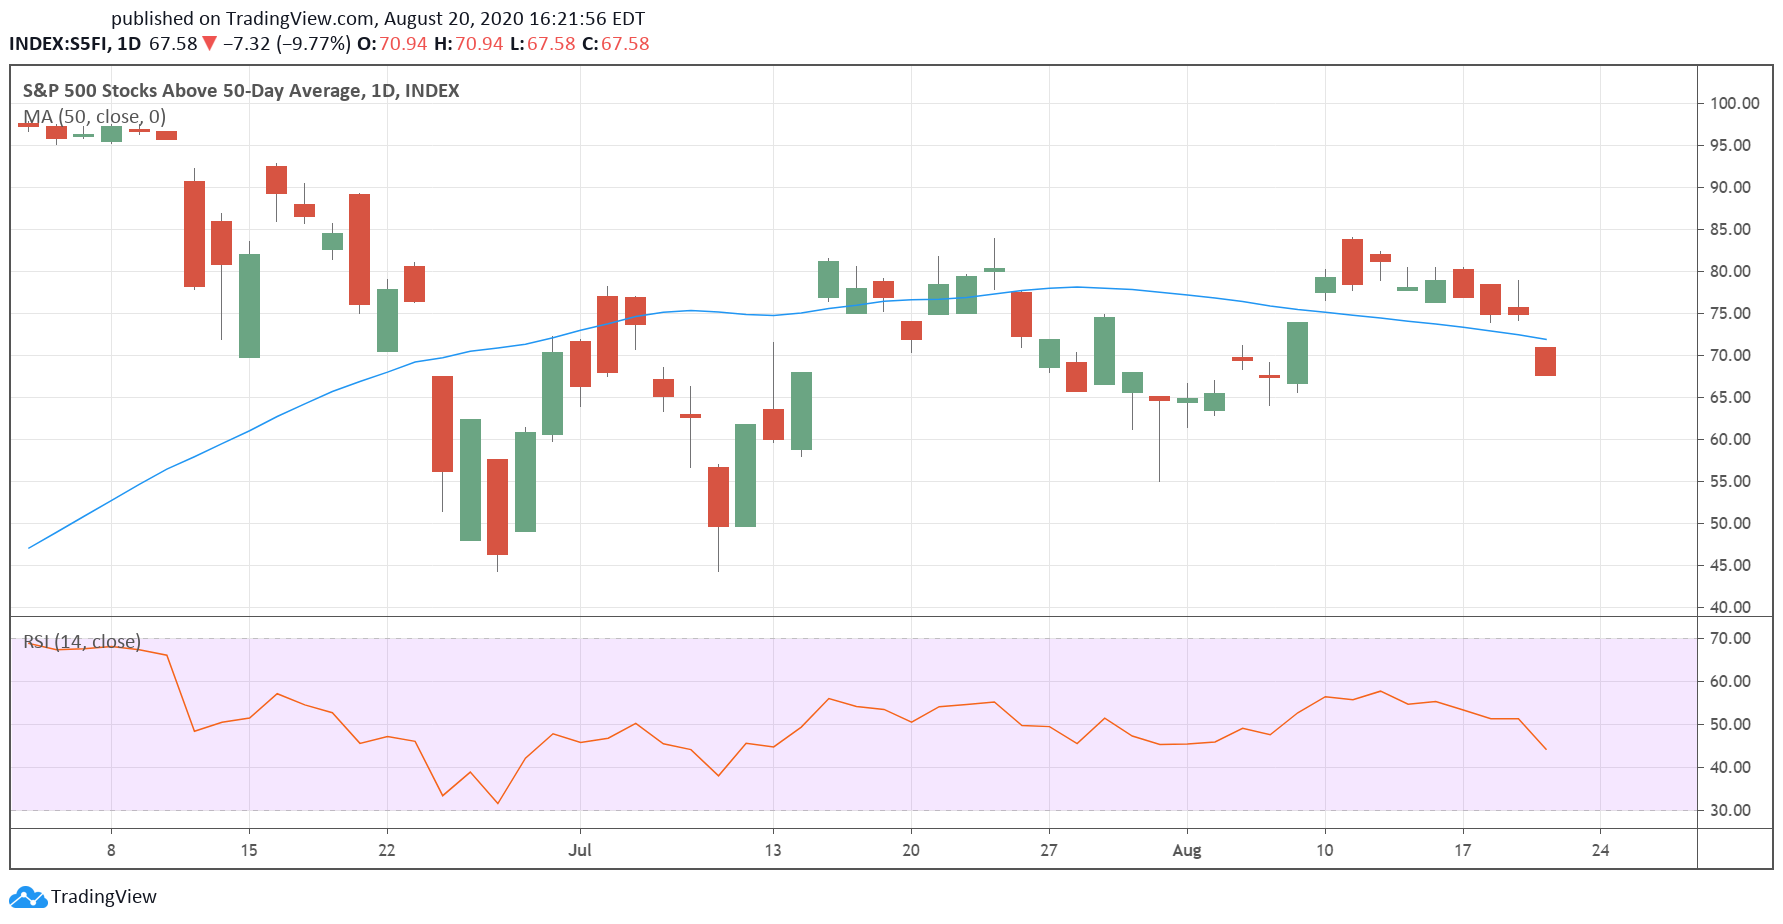
The number of stocks above their 50-day moving average has been declining over the past few weeks, while the S&P 500 equal-weight ETF has been unable to pass its June 8 highs.
There have been plenty of large-cap stocks that have been left behind in this rally, and in recent weeks, a few have even moved back below their 50-day moving average. Companies such as Intel (NASDAQ:INTC), Micron Technology (NASDAQ:MU) and AT&T (NYSE:T) have recently plunged back below their 50-day moving averages.
Meanwhile, the SPX continues to be led higher, pushed up by just a handful of stocks such as Amazon (NASDAQ:AMZN), Facebook (NASDAQ:FB), and Nvidia (NASDAQ:NVDA).

Disparity Between RSP And SPY
Nothing highlights the sharp divergence better than the Invesco S&P 500® Equal Weight ETF (NYSE:RSP), which has fallen by around 5.5% in 2020 versus the SPDR S&P 500 Fund's (NYSE:SPY) gain of about 5%. The main difference is in the construction of the index, with many of the significant technology stocks accounting for and getting larger weightings due to their gigantic market capitalizations in the main index.
Losing Momentum
More importantly, it seems that the number of stocks above their 50-day moving average has been declining, suggesting the recent rally has been getting even more selective. Since Aug. 12, the number of equities above their 50-day moving average in the S&P 500 has declined to 68% on Aug. 20 from 81.2% earlier in August.
Meanwhile, the advance-decline line, which tracks the number of stocks rising and falling, in the S&P 500 recently peaked on Aug. 12 at 1222.53. Since that time, that line has been trending lower despite the S&P 500 index going on to make that record close.

Overall, the number of declining stocks with positive momentum would seem to suggest that the recent rally is weaker than it would seem, and one must wonder just how much longer the rally can remain sustainable. After all, with companies like Intel and Micron dropping sharply in recent weeks, it could even be sending warnings about the health of the sector they represent.

Not All Have Recovered Equally
The weakness across stocks and sectors is relatively broad with Citigroup (NYSE:C), Eli Lilly (NYSE:LLY) and Exxon Mobil (NYSE:XOM) all struggling to recapture or hold on to moves above their 50-day moving average. The weakness across this large group of stocks is likely one reason why the equal weight ETF has underperformed by such a wide margin as the ETF does not give a higher weighting to the companies with larger market caps.
While it is great to see that the S&P 500 has recouped all of its losses from the February and March lows into the nationwide shutdown, it comes with the caveat that not all stocks have recovered equally, and that not all stocks have seen a sharp rebound. If anything, the recent highs in the market could even highlight the disparity between stocks and sectors.
Only time will tell just how sustainable the rally is and whether higher highs are on the way.
