Would you hire a money manager that manages your wealth on false assumptions?
It seems like a bad idea, but many people unknowingly opt for such a management style in their retirement plans.
Target Maturity Funds are one of the fastest-growing mutual fund sectors of the last decade. These passive strategies are most popular in 401k and other retirement plans with limited options and long investment time horizons.
Wall Street nicknames them “set ‘em and forget ‘em” funds because their strategy purportedly adjusts risk lower as you age. At first blush, such a strategy makes sense as risk tolerance is often a function of age. However, the purveyors of these funds fail to disclose that measuring risk is a function of the prices and valuations of assets.
Changing asset allocations based solely on the calendar is playing roulette with your financial well-being.
What Are Target Funds
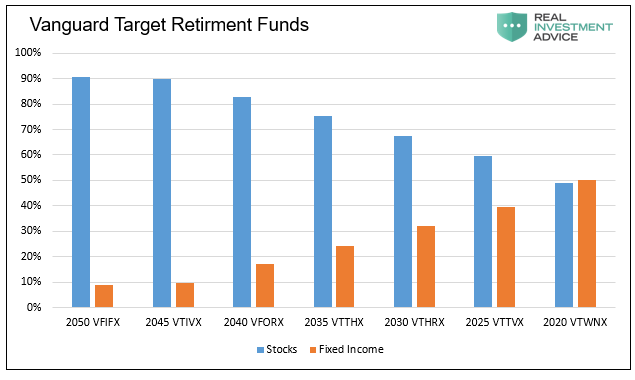
Target (NYSE:TGT) Funds are passive mutual funds run by basic algorithms. The funds slowly allocate away from stocks and toward bonds based on a target future date. For example, a fund with a 2050 target date will initially invest heavily in stocks, with the remainder in fixed income assets. As the fund ages, it reduces equity exposure leaning more toward fixed income.
The table below shows how the Vanguard family of Target funds transition from 90/10 allocation of stocks to fixed income to 50/50 as they reach the target date.
Unreliable Assumptions
Target date funds are based on one simple thesis- as we age, we should reduce financial risks.
There is sound logic to lessening financial risk as you age. First, there are fewer years of future income and investment gains to make up for potential investment losses with each passing day. Second, for those entering or already in retirement, the stability of wealth to cover current and future living expense is critical.
Target funds fail in their complete lack of consideration for measuring risk. Equities, for example, are inherently riskier when fundamental valuations are above average and recent performance has been strong. Conversely, they are less risky at low valuations with beaten-down share prices.
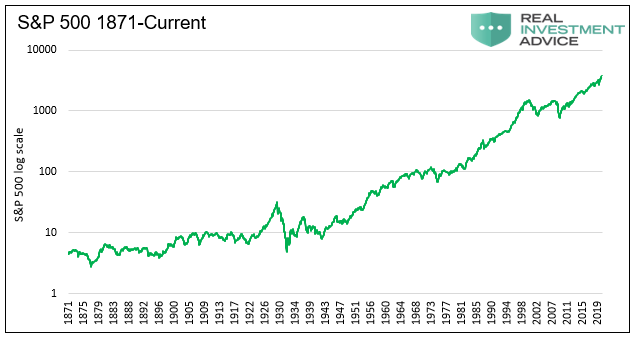
To better understand the problem with allocating based solely on a future date, we start with the graph below. The chart makes it appear as though the S&P 500 is a reliable growth machine. Why not have a strategy that relies on the trend continuing?
Unfortunately, for us mere mortals, with 10-30 year investing time frames, we best zoom in on the graph in shorter time horizons.
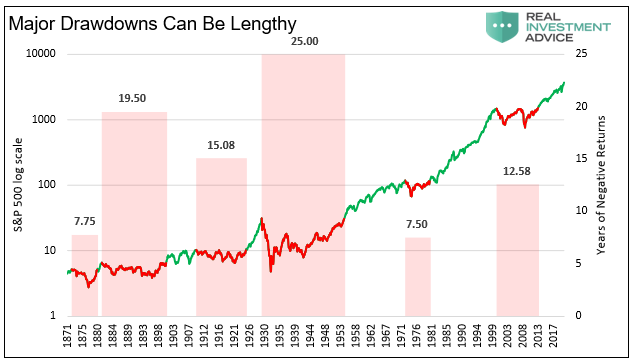
Shown below is the same graph but annotated differently. The red lines represent extended periods where the index had negative returns. The red bars quantify how long those periods lasted.
Stocks rise over very long periods, but shorter periods often see long periods of consolidation with no upward progress. If you were unfortunate to start investing in 1929, it was not until 1954 till you saw prices back at 1929s levels. But for those that started investing in 1951 or 1981, the equity market trend was primarily upward.
The start and end dates of your investment time horizon matter greatly. Blindly allocating to equities based on age and failing to account for market risks is a recipe for failure.
Who can predict the future?
Quite often we hear investors state the future is unpredictable. Accordingly, they claim equities offer much better historical returns than bonds. As such, why not roll the dice on history and go all-in on equities.
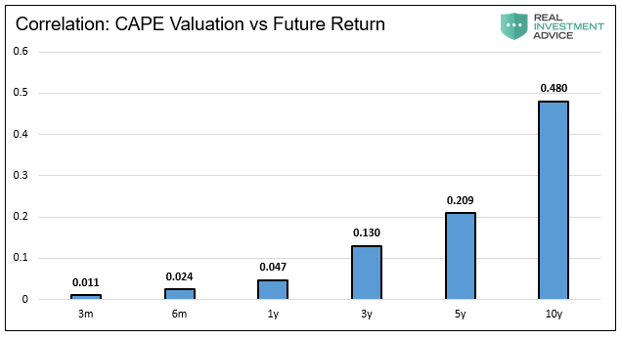
No one can tell you with any certainty what stocks will do tomorrow or next month. However, looking further into the future, market returns become easier to forecast. The graph below shows stock returns become increasingly dependent on valuations as the investment horizon increases.
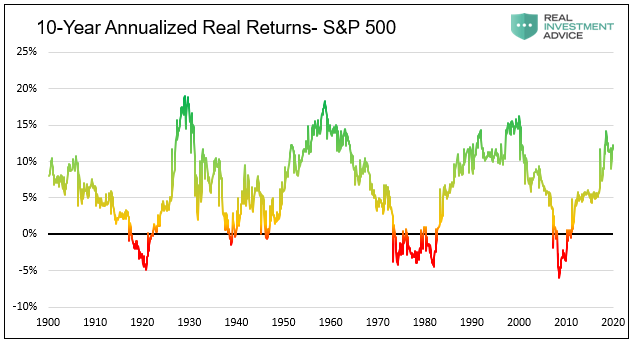
The next graph shows 10-year rolling returns on the S&P 500. The simple takeaway is that returns are cyclical.
Periods in which equities are overpriced with high valuations are followed by periods with lower returns. Conversely, periods when stocks are cheap, are often followed by periods of strong returns.
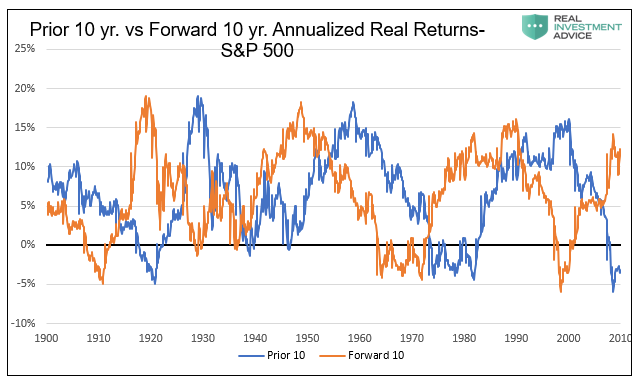
To better stress the point, the following graph compares ten-year forward annualized returns to 10-year prior annualized returns. Quite often, the two lines mirror each other. For example, for the ten years ending March of 2009, the market returned -6% annually. The annual return for the next ten years was over +14%.
Valuations As Predictors
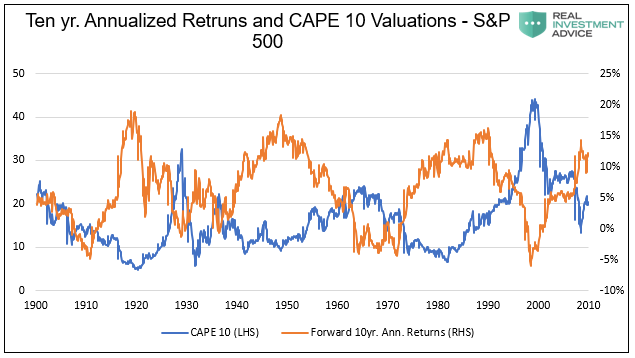
Now we focus on fundamental valuations, or how much investors are willing to pay for future earnings.
The following graph shows when valuations are low, forward returns tend to be higher and vice versa.
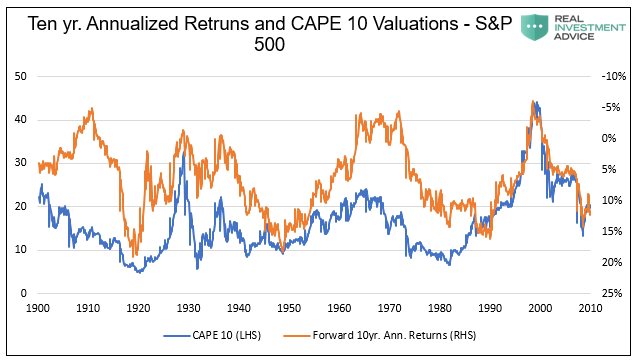
To further illuminate the strong correlation between valuation and returns, we present the same graph above but with the right-hand Y-axis (returns) in inverse order. Again, the higher the valuation, the lower the returns in the following ten years.
Summary
In almost all cases, aversion to risk should increase with age. The problem is that target funds do not assess risk, just your supposed tolerance to risk. There have been multiple times in history when valuations and prior returns were well above average. At these times, a 30-year-old with a passive equity-based strategy should have reduced their equity exposure. Conversely, there are times in history when prices and valuations were so beaten down that a 70-year-old should have had high exposure to equities.
We picked on equities in this article, but the same logic applies equally to bonds and most other asset classes.
Today, valuations stand at extreme highs. We should expect annualized equity returns of zero or even below zero based on the regression of historical returns and valuations. If your wealth is actively managed, current high exposure to equities is fine. The advice assumes you or your manager is aware of the risks and ready to act if necessary.
Most 401ks offer their participants many alternatives alongside target funds. For those that elect to take passive strategies, like target funds, we strongly advise that you assess your risk profile and that of the markets and invest accordingly.

