The S&P 500 continues registering highs for the record books. Yet, the benchmark is reaching new peaks with less participation from its constituents.
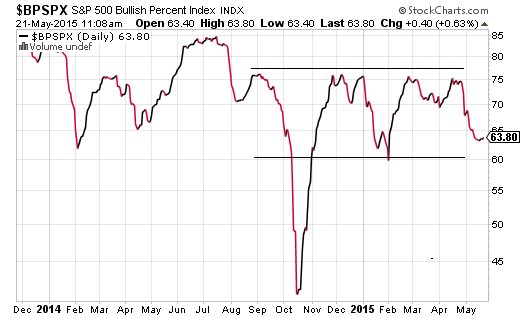
Consider the chart of the Bullish Percentage Index (BPI) for the S&P 500. Typically, a stock market bull is at its healthiest when the majority of companies are moving higher in established uptrends. Most of the highs over the last 9 months – September, November, December, March, April – experienced breadth readings of 75%. Today’s bullishness? 63.8%.
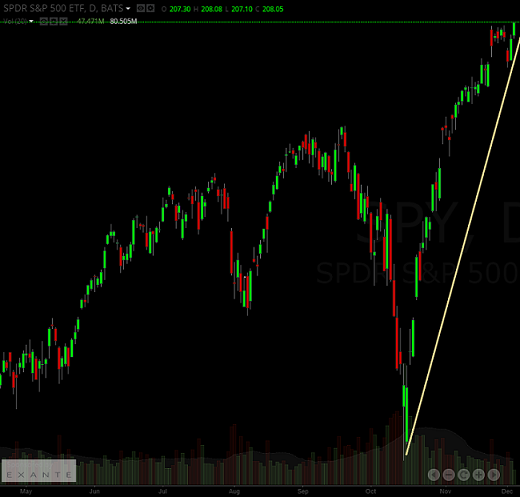
Since 2011’s euro-zone crisis, the singular threat to the bull market’s well-being came in October of last year. Stock market volatility was soaring as the third iteration of quantitative easing (”QE 3″) had been wrapping up. Similarly, investors were rushing into the perceived safety of government bonds all around the globe. Then came the moment when U.S. stocks were approaching the correction mark of 10% off the top. That’s when the U.S. Federal Reserve blinked. St. Louis Fed President James Bullard publicly announced that quantitative easing could always be revived or extended. QE 3.5? QE 4? Stocks rocketed in a matter of minutes, recovering lost ground and claiming new territory on what many have dubbed the “Bullard Bounce.”
Perhaps ironically, the Fed has not actually raised borrowing costs in nine years. And it has been six-and-a-half years that the central bank of the U.S. has kept its target lending rate near zero percent. During those six-and-a-half years, every asset under the stars (other than cash equivalents) has appreciated handsomely. And why wouldn’t risk assets gain in value when money usually flows towards anything greater than a 0% return.
The question nearly every pundit, money manager and steward is asking at this point is what will transpire when the Fed hikes overnight lending rates for the first time in nine-plus years. For instance, analysts at Bank of America have been conspicuously bearish with the following lose-lose summertime scenarios: (1) The broader economy improves, giving the Fed ammunition to raise rates, ultimately causing stock market volatility and borrowing cost instability, or (2) The broader economy does not improve, and the slowdown in corporate earnings results in exorbitantly priced stocks moving to obscenely priced levels.
As bearish as B of A has come across, Goldman Sachs (NYSE:GS) analysts have been even more cautionary. They noted that the forward P/Es for every single sector of the S&P 500 resides at cyclical peaks and that the median stock in the S&P 500 trades in the 99th percentile of historical valuation for forward P/Es. Their conclusion? Expect marginal 2015 gains on stock buybacks and dividends alone.
If one combines the assessments of both Goldman Sachs and Bank of America (NYSE:BAC), one recognizes that the “borrow-n-buyback loop” that has supported stocks for six-plus years may face significant headwinds going forward. Up until this point in time, U.S. corporations have bought back more than $2 trillion of their own shares through borrowing at ultra-low rates. The borrowed money could have been spent on future growth through research/development, physical facility upgrades, better products/services or more meaningful hiring. Alas, all that one can say is that corporations do not trust the economy at large, preferring fortuitous borrowing terms to lower shares in existence and prop up the perception of the profitability per those shares. Still, if buybacks are the reason for stock prices moving higher (a la Goldman Sachs) and the economy should demonstrate improvement in the months ahead (a la Bank of America), one would surmise a combination of less borrowing at higher rates as well as less buybacks as companies invest capital in future growth.
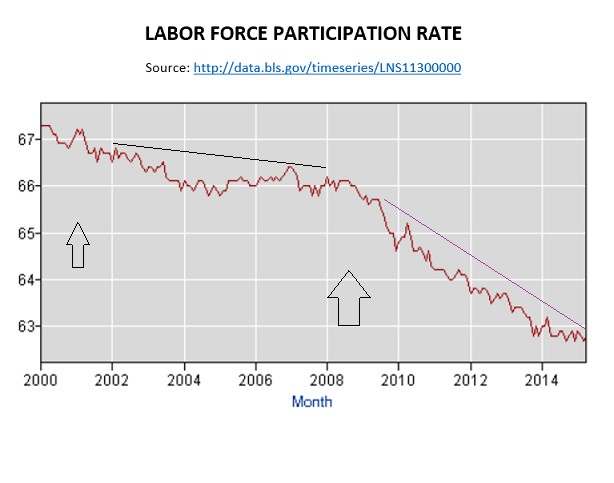
From my vantage point, however, I do not anticipate economic acceleration. For all the chatter about exceptionally low jobless claims and the 5.4% unemployment rate, the reality on actual employment is far less compelling. According to a recent Harris poll of working-aged Americans, 40% of folks have given up looking altogether. They are not counted in the jobless claim or headline unemployment data. Simply stated, a massive outflow of working-aged people have been leaving the workforce. Moreover, when one compares the slope of the decline in the labor force participation rate (actual employment rate) after the 2001 recession with that of what has occurred since the 2008-2009 recession, it is easy to see that we’re not merely examining a happy trend of retirees exiting their jobs to play golf.
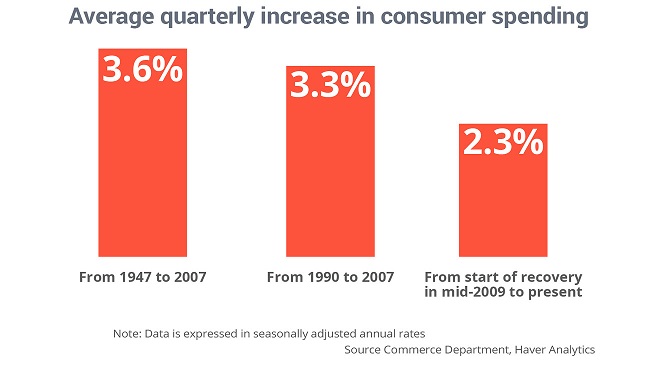
Couldn’t consumer spending pick up the economic slack? After all, the consumer supposedly explains 65%-70% of the gross domestic product (GDP) in the U.S. Don’t hold your breath. Overall spending since the end of the Great Recession has recovered at a sub-par inflation-adjusted rate of just 2.3%. The average over the last 68 years is 1/3 greater.
Dreadful wage growth and increased consumer saving simply do not bode well for any action by the Federal Reserve. And yet, if they do not get the Fed funds rate out of the zero percent commode, how would the Fed be able to stimulate the economy at a time of actual recession? Since the 1970s, the Fed has always lowered rates in the neighborhood of 500 basis points (5%). Even if the Fed manages to push its target to 0.5% by year-end, and 1% by mid-year 2016, is it not inevitable that we will turn back down to 0% and, if the stock market and economy are struggling enough, should we not expect QE 4?
In sum, investors are placing an inordinate amount of faith in central bankers, particularly the Federal Reserve. Having witnessed the errors in central bank judgment leading up to the dot-com collapse (2000-2002) and the real estate bust (2007-2009), I am less inclined to ignore the probability of a severe policy mistake. (In that matter, I believe the mistake was made when the Fed continued quantitative easing beyond the necessary confidence boost in the first emergency procedure circa December 2008).
I am more inclined to pay close attention to market fundamentals and market technicials. While the former suggest undesirable overvaluation here in the U.S., the latter suggest maintaining one’s allocation. Each of my key late-stage stock ETFs are holding firm to definitive uptrends, from iShares S&P 100 (NYSE:OEF)) to Vanguard Mid-Cap Value (NYSE:VOE) to iShares Minimum Volatility (NYSE:USMV) to Health Care Select Sector SPDR (ARCA:XLV).
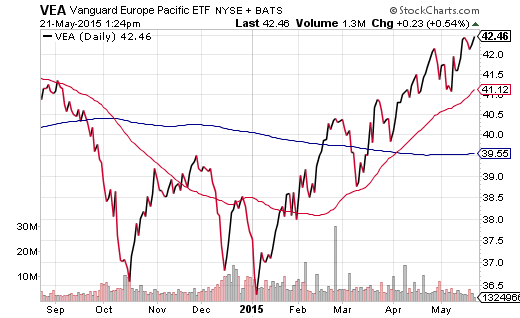
Where there has been room to put new cash to work for clients, however, I’ve been allocating to foreign assets – hedged and unhedged. The fundamentals are far more appealing at every turn, from price-to-sales ratios to dividend yields to P/Es. I remain committed to funds like iShares Currency Hedged MSCI Germany (NYSE:HEWG), iShares MSCI Germany (ARCA:EWG), Currency Hedged MSCI EAFE (HEFA), Vanguard FTSE Developed Markets (NYSE:VEA) and iShares MSCI EAFE Minimum Volatility (NYSE:EFAV). Each boast strong technical uptrends accompanied by a “golden cross” – a bullish indicator with a 50-day moving average crossing above a 200-day.
