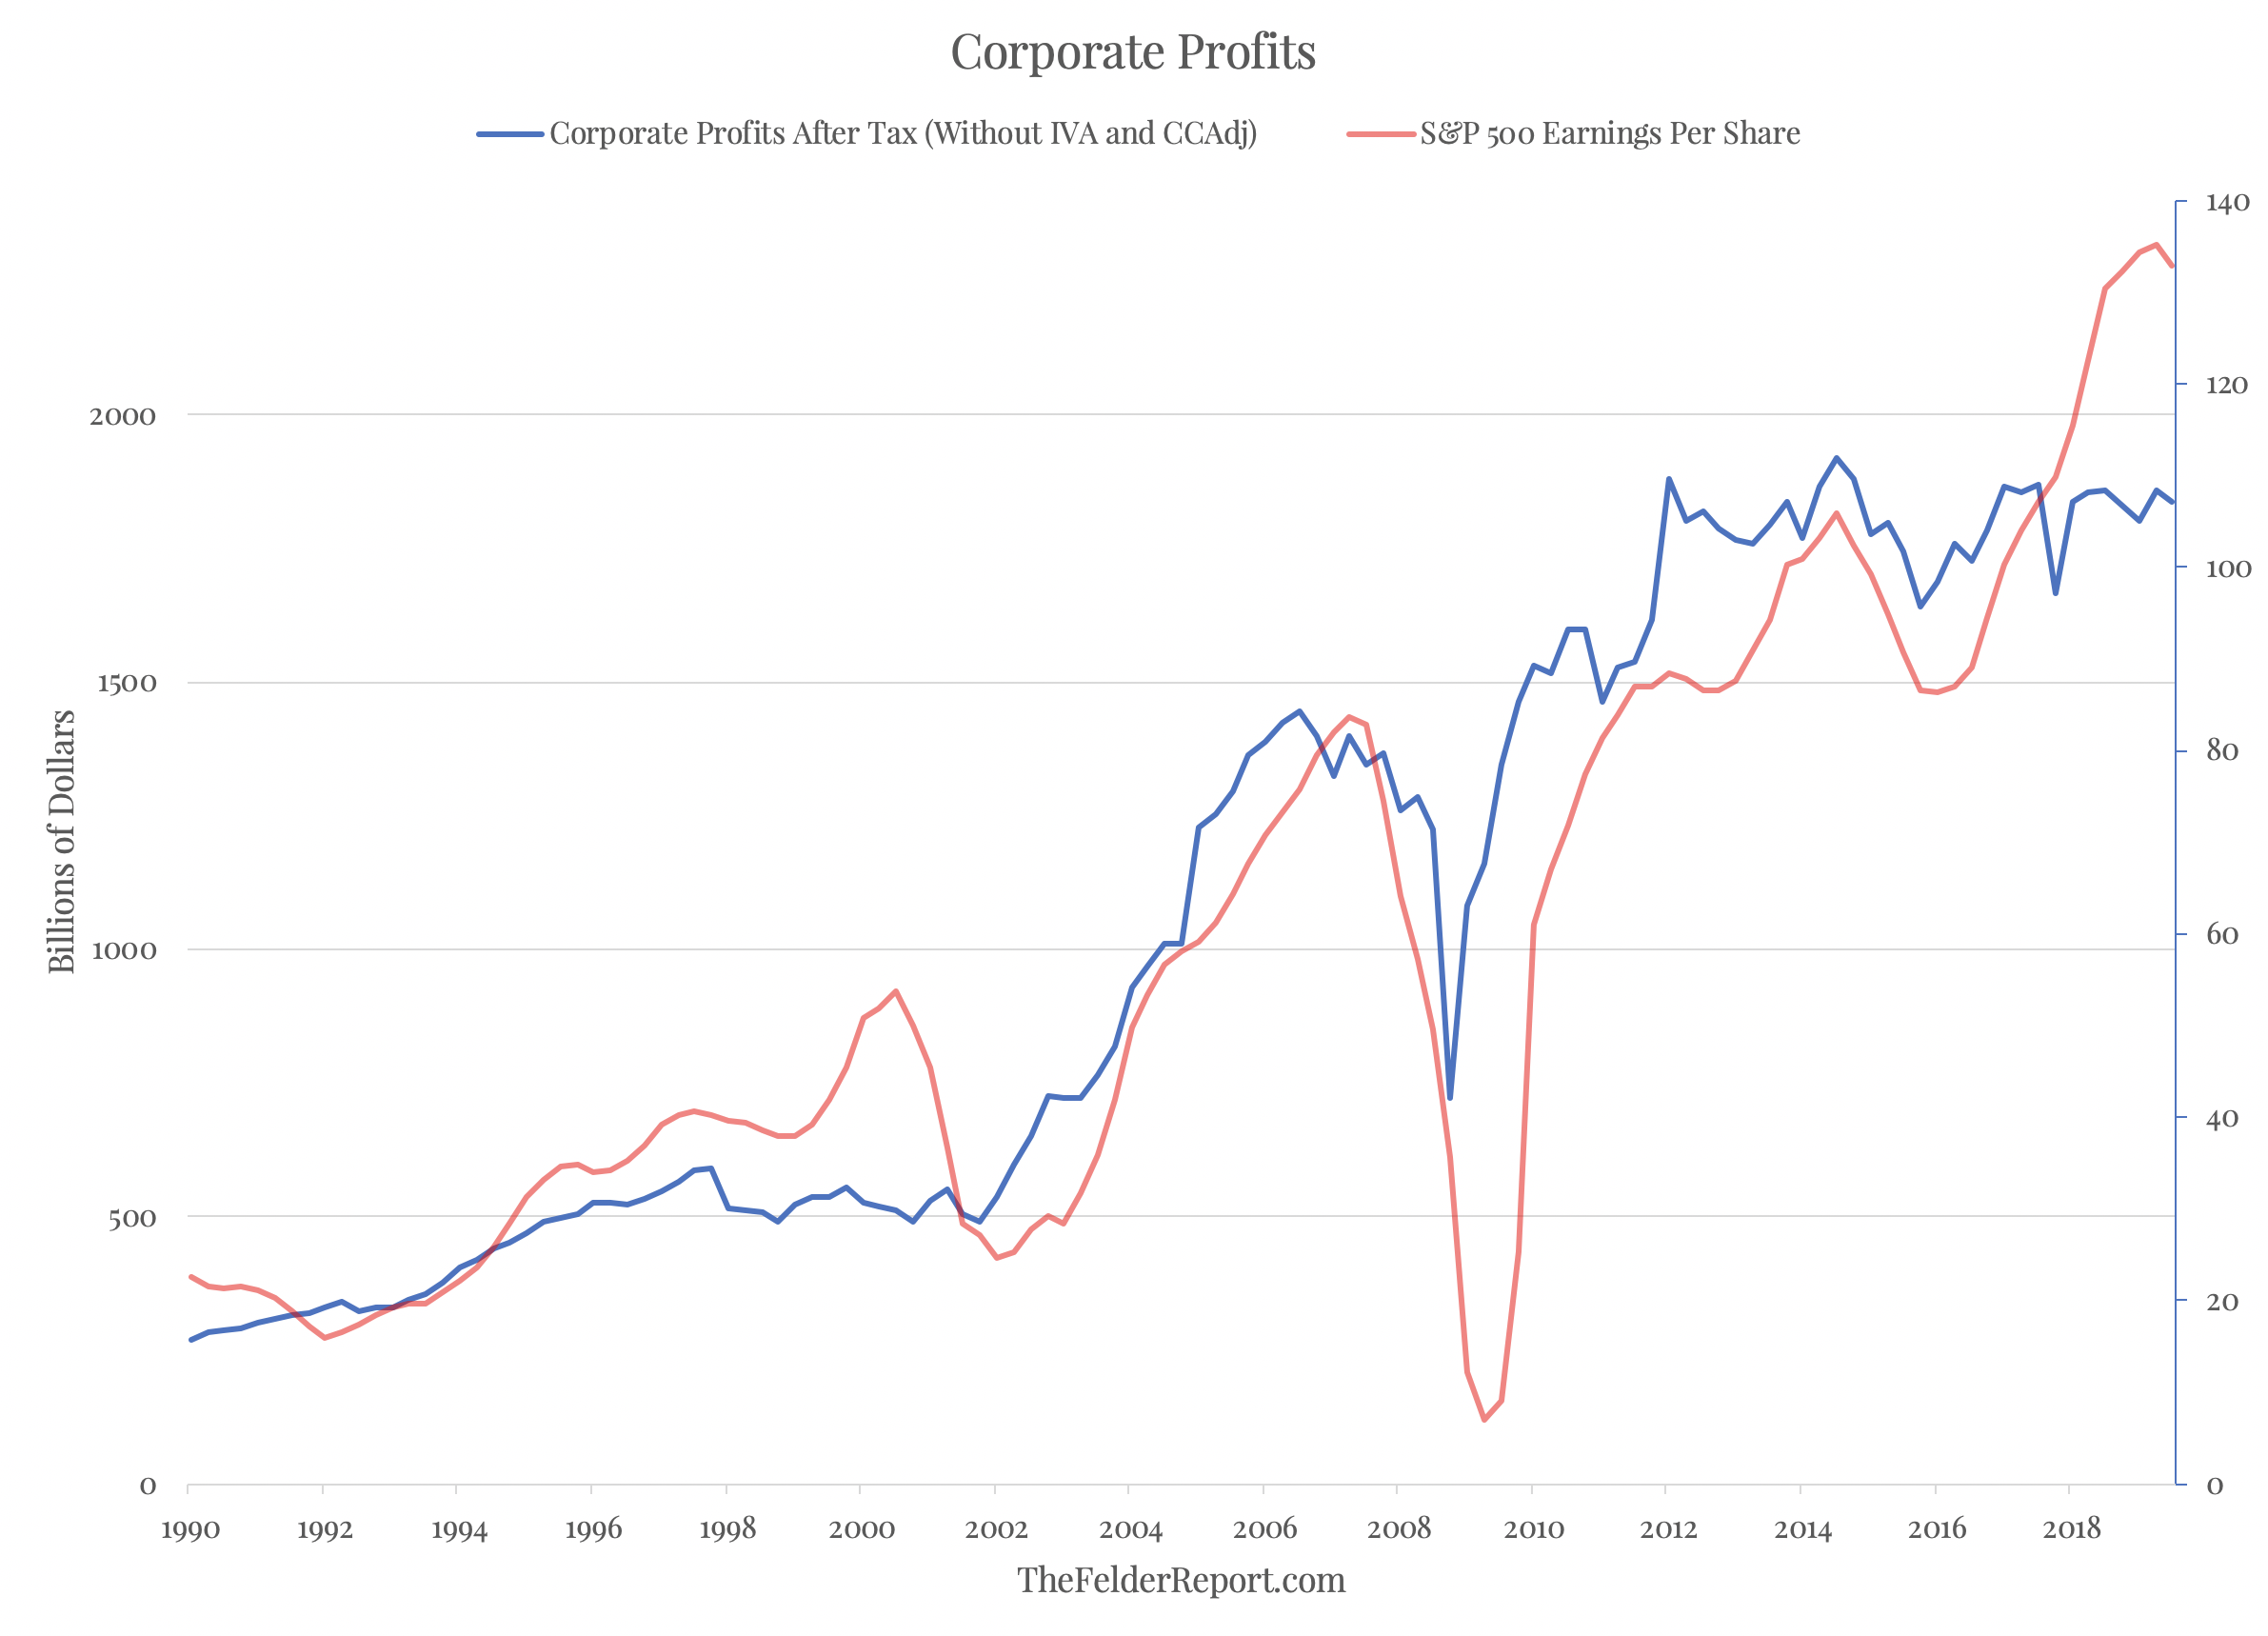
Over the past few years there has been a dramatic divergence between corporate profits, as measured by the Bureau of Economic Analysis, and the earnings of the S&P 500 with the former stagnating and the latter soaring. This is notable because the two regularly correlate very closely. As a result, some have wondered which is the true measure of corporate profits and which is the mirage.

Back in March of 2011, the BEA put out a piece explaining the differences between the two measures that helps to understand why we are seeing such a gap between them today. There are two important considerations here. First, the underlying components being measured here are dramatically different:
Because the composition of companies in the S&P 500 changes regularly, the S&P 500 earnings measures reflect a shifting market basket of corporations, and the series for reported earnings and operating earnings are dis- continuous over time. Their growth rates partly reflect changes in the composition of the index.
Certain sectors of the economy—such as construction, legal services, and medical services—may be under-represented because fewer corporations in these sectors meet the criteria for inclusion in the S&P 500 index. Thus, the industry composition of the S&P 500 earnings does not reflect the industry composition of the overall economy. Specifically, energy, manufacturing, information technology, and financial corporations are disproportionately represented in the S&P 500 and in some recent years have accounted for more than 80 percent of S&P 500 operating earnings.
I would highlight the difference here between information technology’s weighting in the S&P 500 of 23.2% and its GDP weighting of just 5.5%. The S&P 500’s greater earnings growth than that of the broader measure of corporate profits could be partly attributable to the fact that it is made up by a very large number of profitable technology companies and excludes a number of less profitable firms in other industries that are included in NIPA’s calculations of corporate profits.
Second, the two measures use vastly different accounting for employee stock options:
NIPA accounting and tax accounting have always treated employee stock options as an expense only when (and if) options are exercised. It is an operating expense and therefore always a cost deduction in the NIPA profits calculation. However, GAAP accounting now expenses options at grant or on a schedule beginning at grant. The valuation of the options is based on a formula that is in turn based on the right to eventual exercise, and considerable discretion is allowed.
GAAP accounting, which S&P 500 companies use, allows for a stock options to be granted and then expensed over time using the value of the option at time of the grant. NIPA accounting only expenses the option once it has been exercised, usually at a much later date and with a much higher expense. The IRS explains it this way:
To comply with its financial reporting requirements, the company must estimate the value of the equity-based compensation at the time of grant. For tax purposes, the equity-based compensation is not reported as compensation until the vest date or exercise date (depending on the type of equity-based compensation at issue). Large discrepancies are common.
The “large discrepancies” between corporate profits and S&P 500 profits then can probably be explained, in part, as a product of the difference in using tax accounting and using GAAP accounting for stock options. Tax accounting has resulted in a much larger expense than GAAP accounting in recent years simply because the value of the options have grown a great deal along with stock prices over time.
These two explanations in tandem probably help to explain why we saw a similar gap in the earnings measures back in 2000. Similar to today, the index had become crowded with “high quality” and “growth” names while many “bricks and mortar” or “value” companies had fallen out of favor and thus out of the index. At the same time, a roaring bull market boosted the value of stock options that served to reduce NIPA profits when they were exercised and inflated the value of GAAP profits by reducing tax burdens (in addition to the preferential accounting treatment).
In short, it seems that the boost in earnings over the past few years in S&P 500 profits could be, to a large degree, merely a product of the bull market rather than the other way around. Investors have crowded into a smaller number of firms that have inordinately benefitted during the current cycle and, in part, due to this crowding, these same firms have been able to report even greater profits by way of a quirk in stock option accounting.
The question investors should now be asking is this: ‘Is this recent earnings trend sustainable or is it merely the product of an equity bubble?’ As the 2000 experience shows, it’s more likely to be the latter. The BEA concludes, at the bottom of the cycle, “S&P 500 earnings measures fall by larger percentages during recessions than the NIPA profits measures and then rise faster to converge back toward NIPA profits trends.” I would suggest this probably works in reverse at the top of the cycle.
