Most traders understand what a “waterfall event” is if you've been trading for more than 3 years. Nearly every downside price reversion event initiates in a breakdown event (the first tier of the waterfall event) which is followed by additional deeper waterfall price collapses. Almost like price breaks lower, finds support, settles near support, then breaks lower targeting deeper price support levels.

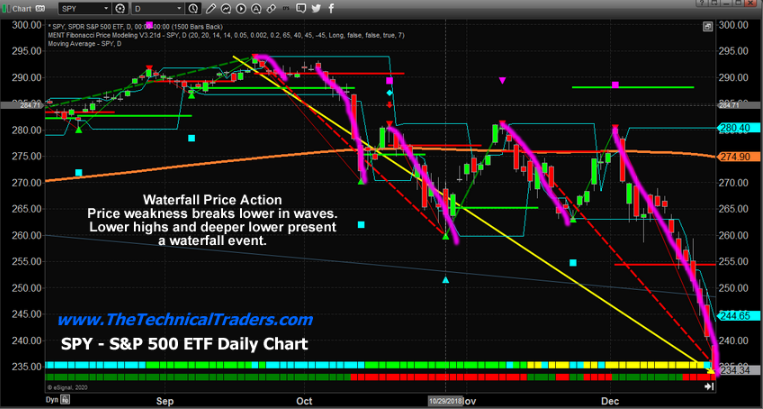
Daily SPY
This example SPY chart from October 2018 through December 2018 highlights this type of event almost perfectly. With each tier in the waterfall event, price searches for new support levels as price weakness drives price lower throughout each breakdown event. We've highlighted these breakdown events with the MAGENTA lines drawn on this chart.The recent downside price rotation after the world was alerted to the Wuhan virus presented a very clear “first-tier” waterfall event. This first move lower is often rather condensed in size and scope – yet often within days of this first event, a bigger second downside waterfall event takes place confirming the bearish breakdown has momentum. We believe this first move lower could be the first real tier in a broader global market waterfall event which may result in a much deeper price reversion event.We believe the total scope of the Wuhan virus will not be known for at least another 20 to 30+ days. After that span of time, we'll know where and how aggressive this pandemic event has spread and what real capabilities we have for containment. Therefore, we believe the downside price concern within the global markets is very real and just starting.Very much like what happened in October 2018, the initial downside price move initiated on the US fed news and expectations. When the Fed announced a rate cut, which shocked the markets, investors waited to see how the markets would react and within only 5+ days, the markets reacted violently to the downside.Friday, January 24 was the “trigger date” for the breakdown in global markets from the news of the Wuhan virus. We believe any further downside risk to the global markets will be known within another 5 to 10+ trading days – as more information related to the spread and containment capabilities of the virus are known. Therefore, we are attempting to alert our followers and friend to the very real potential of a price breakdown event, a “waterfall event”, that may be set up in the global markets.Daily Transportation Index
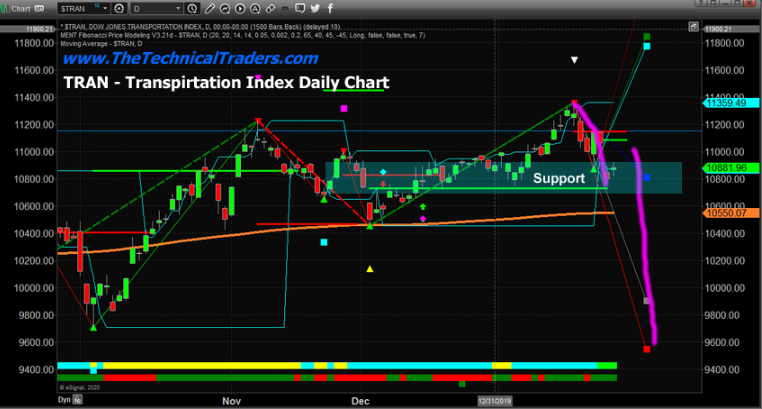
This daily Dow Jones Transportation chart highlights the recent breakdown in price that could be considered the first tier of the waterfall event. The support level, highlighted in LIGHT BLUE, suggests price may attempt to stall near 10,800 before any further price breakdown happens. A second waterfall tier could push the price well below the 10,000 level as the next real support exists near 9,9250.


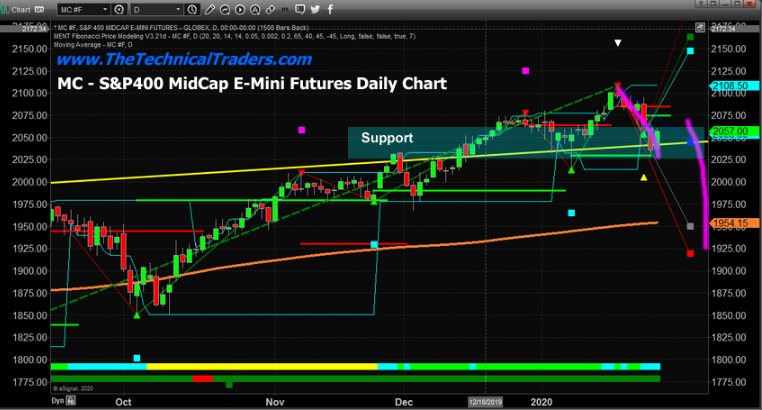
Daily 400 Midcap Index
This daily MC (S&P Midcap 400) futures chart highlights a similar price pattern. The initial breakdown tier is very clearly illustrated where the price fell to immediate support near 2050. We believe any further waterfall tier event may push the price below the 2000 level and target real support near 1952.Daily Financial Sector Index
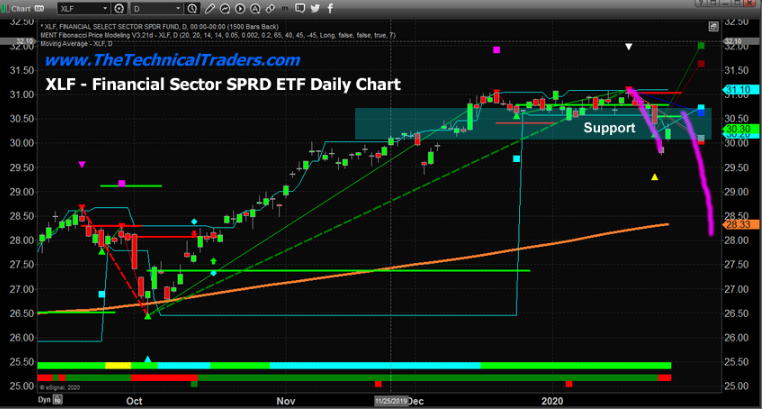
This Financial Select Sector SPDR® Fund (NYSE:XLF) daily chart, again, highlights the first tier breakdown in the price of the potential Waterfall event. This is actually one of the clearest examples of how price operates within this type of rotation. The initial downside tier broke through support near $30.00 and has begun to rally back above this level. The LIGHT BLUE highlighted support range shows us where the first tier may stall. Any further breakdown in price may push the price below the $28.50 level as price searches for new support.

We've referenced the 1855 “Third Plague Event” that hit in China and quickly spread to India, SE Asia and other neighboring countries as an example of what may happen with the Wuhan virus. The 1855 event killed over 15 million people (nearly 1.25% of the total global population at the time) and lasted until 1960 when the Plague cases dropped below 200.
We urge all traders and investors to prepare for a broader downside market event in the future – possibly a “waterfall event”. We'll know more about the size and scope of this potential pandemic within 30+ days – but this may become a much bigger issue across the globe very quickly. The volatility this event may create in the global markets is an ideal setup for skilled technical traders. In the last week, we locked in profits on two trades SSO for 6.5% and TLT for 3%.
