I readily acknowledge that I know precious little about the world of art. In fact, I would struggle to distinguish Picasso from Velazquez, Van Gogh from Monet, or DaVinci from Rembrandt.
On the other hand, my brain has retained a bit of knowledge about several artists for one reason or another. Not only did I see the 2002 movie on the life of Frida Kahlo, but I attended a Kahlo exhibit in New York. Similarly, whenever I gaze upon a canvas covered in multi-colored blood spatter, I think of Jackson Pollock. That might not be entirely fair to abstract expressionists, yet Pollock’s work makes me feel as though I too could create a masterpiece.
Last week, however, I came to discover the oddity of Francisco De Goya. Why? I toured the Museo del Prado while vacationing in Spain. At the museum, you cannot go anywhere without seeing a Goya creation. And you certainly can’t miss one of his most famous works, Saturn Devouring His Son. Admittedly, as gruesome and as disturbing as the “Black Painting” is, I felt obligated to snap a picture of it. (See below.)
Why am I bringing up Goya or the mythological Saturn eating his children? Good question! It is because the wealthiest among us buy and sell art via auction houses. And the most popular auction house around the globe is Sotheby’s (BID) – a public corporation that offers its shares on the New York Stock Exchange.
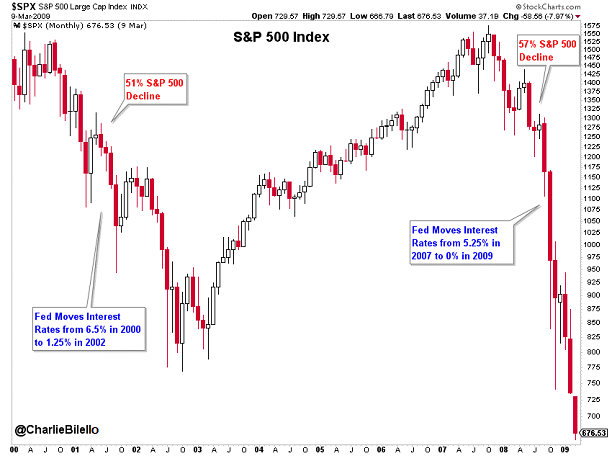
There’s more. Sharp price declines in Sothebys Holdings Inc (BID) foreshadowed the 2000 tech wreck and the 2008 financial crisis. The question is, might a similar pattern be emerging here in 2017?
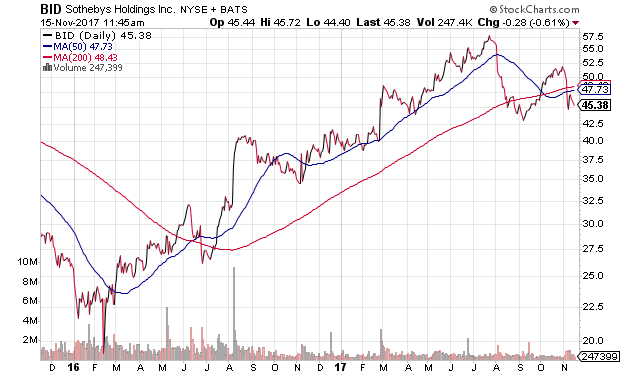
Certainly, Sotheby’s (BID) has declined a bearish 22% from a record perch. Its 50-day trendline has crossed below its 200-day trendline – an occasion known as a “death cross.” And the current price of BID is also below its key moving averages. Few technicians would look favorably upon these developments for the company itself.
On the flip side, successful forecasting by Sotheby’s (BID) shares may be folklore. There have been five 33%-plus beat-downs for Sotheby’s (BID) since 1989. On three occasions, those declines preceded bearish drops for the S&P 500. The other two? Nada. The broader market was no worse for the wear.
Perhaps in isolation, what happens at Sotheby’s stays at Sotheby’s. Yet I wonder how the planets might align when you combine this type of evidence with a number of other factors. For example, with 92% of corporations reporting, S&P 500 GAAP earnings for the 3rd quarter of 2017 have only grown 3% since the 3rd quarter of 2014. Just 3% in the 3 years!
Three years of negligible earnings growth should matter to commentators and talking heads in the financial media. After all, they consistently discuss an earnings-driven market. And yet, the S&P 500 has tacked on 32%-plus over three years, sticking a fork in the notion that earnings growth has much to do with recent stock price gains.
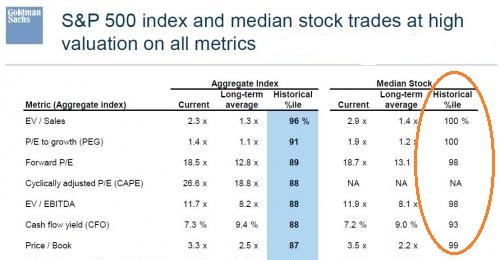
Not surprisingly, then, the price that people are paying for disappointing earnings growth (EG) and/or earnings themselves (E) is suspect. The median stock is remarkably overvalued at the 98%, 99% or 100% historical percentile.
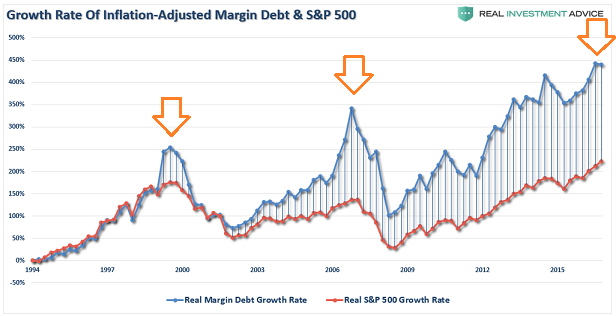
Unfortunately, there are no data combining a Sotheby’s sell-off with several years of disappointing earnings as well as extraordinary overvaluation extremes. For that matter, you will not find data aggregating the auction house’s share performance with the expansion or the reversion of margin debt. The one thing that we do know is that significant margin debt decreases tend to precede massive leverage unwinding alongside severe stock price depreciation.
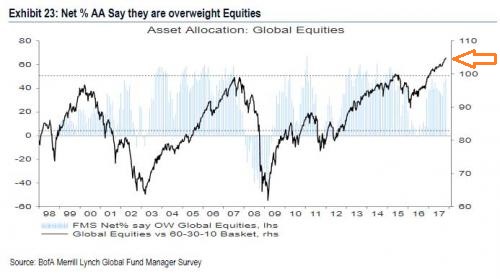
Another data point that may or may not shed a light on probable market outcome is the net percentage of folks who report being “overweight stocks.” Peaks occurred before the dot-com disaster in 2000 as well as the real estate collapse (2008).
Today, the percentage of participants who report being overweight equities sits at a record high. Irrational exuberance or logical asset allocation?
Keep in mind, stock market gains since the 2008 financial crisis ended largely track the quantitative easing (QE) activity of central banks around the globe. During periods of acceleration (e.g., Federal Reserve with QE1/QE2/QE3, the European Central Bank (ECB) and other CBs around the globe in January/February 2016, etc.), the asset purchases with electronic money credits depressed interest rates and increased stock prices. During periods of limited central bank balance sheet increases (e.g., the Fed’s last asset purchase in December of 2014 through January 2016), stocks struggled with a number of harsh corrections requiring central bank jawboning of reduced rate hike activity.
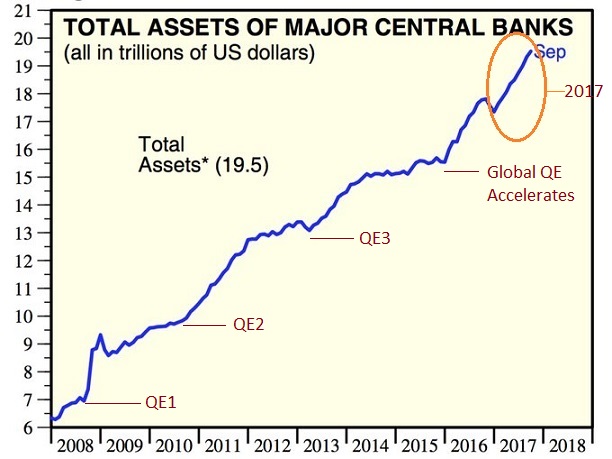
If anyone wonders how stocks could go up since January of 2016 without the slightest hiccup or setback – nearly two full years of equanimity – they need to look no further than the accelerated pace of balance sheet expansion in 2016 and 2017. The global “QE” has been telling us more about market direction than the struggles of Sotheby’s (BID), the overvaluation extremes, the record leverage in margin debt and the net percentage of “overweight equities” combined.
The big issue is whether or not global central bank easing is in the process of slowing. The Federal Reserve explained that it was going to gradually begin reducing its balance sheet (10/17). Meanwhile, they are widely expected to raise overnight lending rates 0.25% in December. In the same vein, all of the other major central banks (e.g., European Central Bank, Bank of Japan, Bank of England, etc.) are beginning to taper their money printing/asset purchase activity or raise rates themselves. Is global QE going to shift toward “quantitative tightening” or “QT?”
If a QE slowdown or a QT inception move faster than the markets are ready for, investors may need to prepare themselves for dips that do not become automatic buying opportunities. After all, the Federal Reserve’s track record at putting out fires is not as wonderful as many are counting on.
Disclosure Statement: ETF Expert is a web log (“blog”) that makes the world of ETFs easier to understand. Gary Gordon, MS, CFP is the president of Pacific Park Financial, Inc., a Registered Investment Adviser with the SEC. Gary Gordon, Pacific Park Financial, Inc., and/or its clients may hold positions in the ETFs, mutual funds, and/or any investment asset mentioned above. The commentary does not constitute individualized investment advice. The opinions offered herein are not personalized recommendations to buy, sell or hold securities. At times, issuers of exchange-traded products compensate Pacific Park Financial, Inc. or its subsidiaries for advertising at the ETF Expert website. ETF Expert content is created independently of any advertising relationship.
