The most fascinating thing about the stock market is that at every single point in time it is possible to make a compelling bullish case…..and a compelling bearish case. Don’t’ believe me? Go ahead and scan the internet for “bullish” and “bearish” arguments regarding the future prospects for the market. But maybe have a sandwich handy – it may take awhile to get through it all.
Why the Stock Market is About to Tank
Having been in the market for awhile (i.e., since the “Hair Era” in my life to the “Not So Much Hair Era” in my life) I have explored moving averages about as much as a person can. Let me sum up what I have learned in the fewest words possible:
Moving averages can be:
A) Extremely useful at times
B) Horribly wrong at other times
That is pretty much everything you need to know. In other words, there are no “perfect” moving average schemes. You have to take the bad with the good. To wit, the moving average method that I use as Portfolio Manager for the Alpha Multi-Income Strategy is designed simply to keep the portfolio out of the stock market during some portion of an extended bear market decline. And historically it has done an excellent job of it over time. It also does get whipsawed from time to time. Painfully so at times.
The Buy and Sell rules are quite simple:
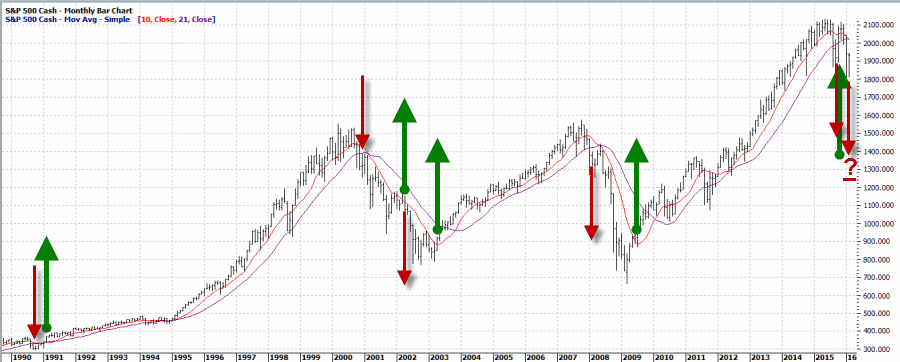
*Sell when the S&P 500 Index (SPX) closes two consecutive months below its 21-month moving average AND also closes below the 10-month moving average
*Buy when SPX closes back above the 10-month moving average
Figure 1 displays the buy and sell signals using this method since 1990.
Figure 1 – Buy and Sell Signals for SPX using Alpha Market Trend Filter
The good news is that it had an investor out of stocks during the bulk of the 2000-2002 and 2008-2009 bear markets, therefore avoiding some spectacular draw-downs. The bad news is that it got whipsawed in 1990 and again (painfully) in 2015. A sell signal occurred at the end of September, the stock market rallied very sharply in October (while this “system” was out of the market) and a new buy signal occurred at the end of October. Since then the market has been awful and now a new sell signal is likely at the end of February 2016.
Repeating now, Moving averages can be:
A) Extremely useful at times
B) Horribly wrong at other times
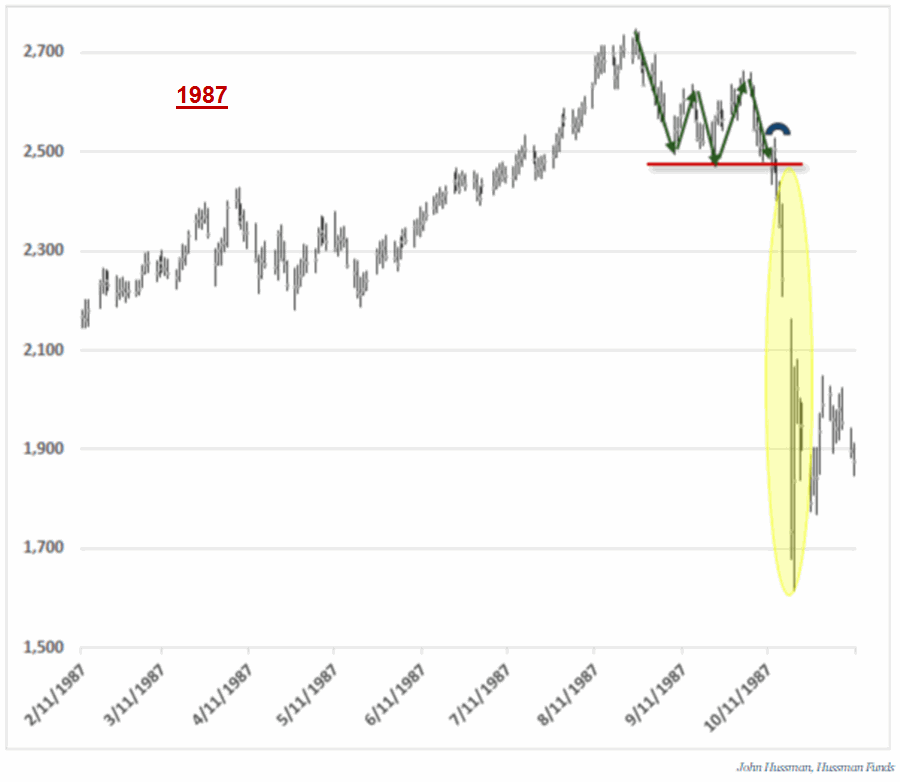
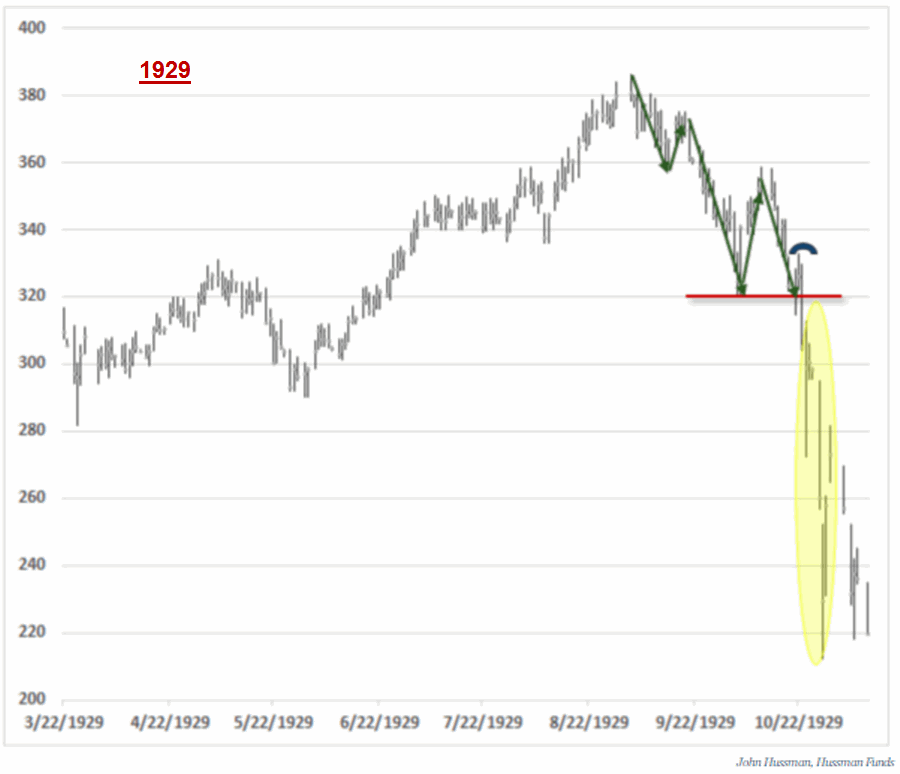
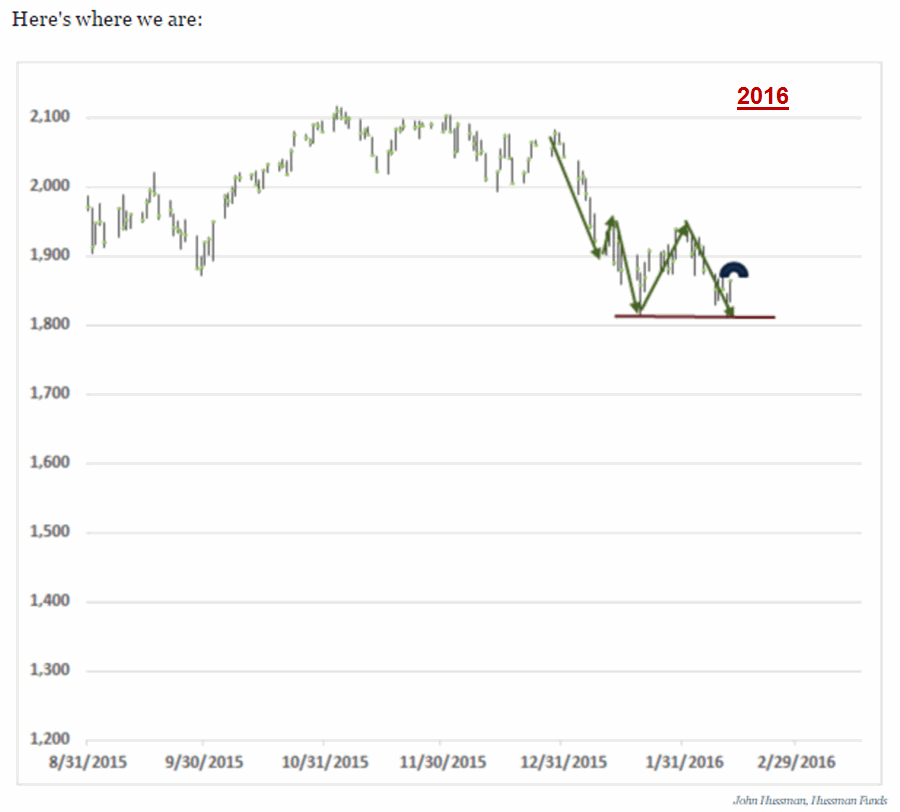
Will this new “sell” signal prove “useful” or “wrong”? One notion that may buttress the bearish case is a comparison between the action in 1929 and 1987 “pre-crash” to 2016. I encourage you to read the article in its entirety however, to make the point see Figures 2, 3 and 4 below.
Figure 2 – Stock market 1929 (Source: John Hussman)
Figure 3 – Stock market 1987 (Source: John Hussman)
Figure 4 – Stock market 2016 (Source: John Hussman)
So are we headed for the next great “Crash”? And will a moving average sell signal at the end of February prove prescient?
Only time will tell. Before panicking please note that in my next piece I will highlight a few reasons to expect a market rally in the near future instead of a crash.


