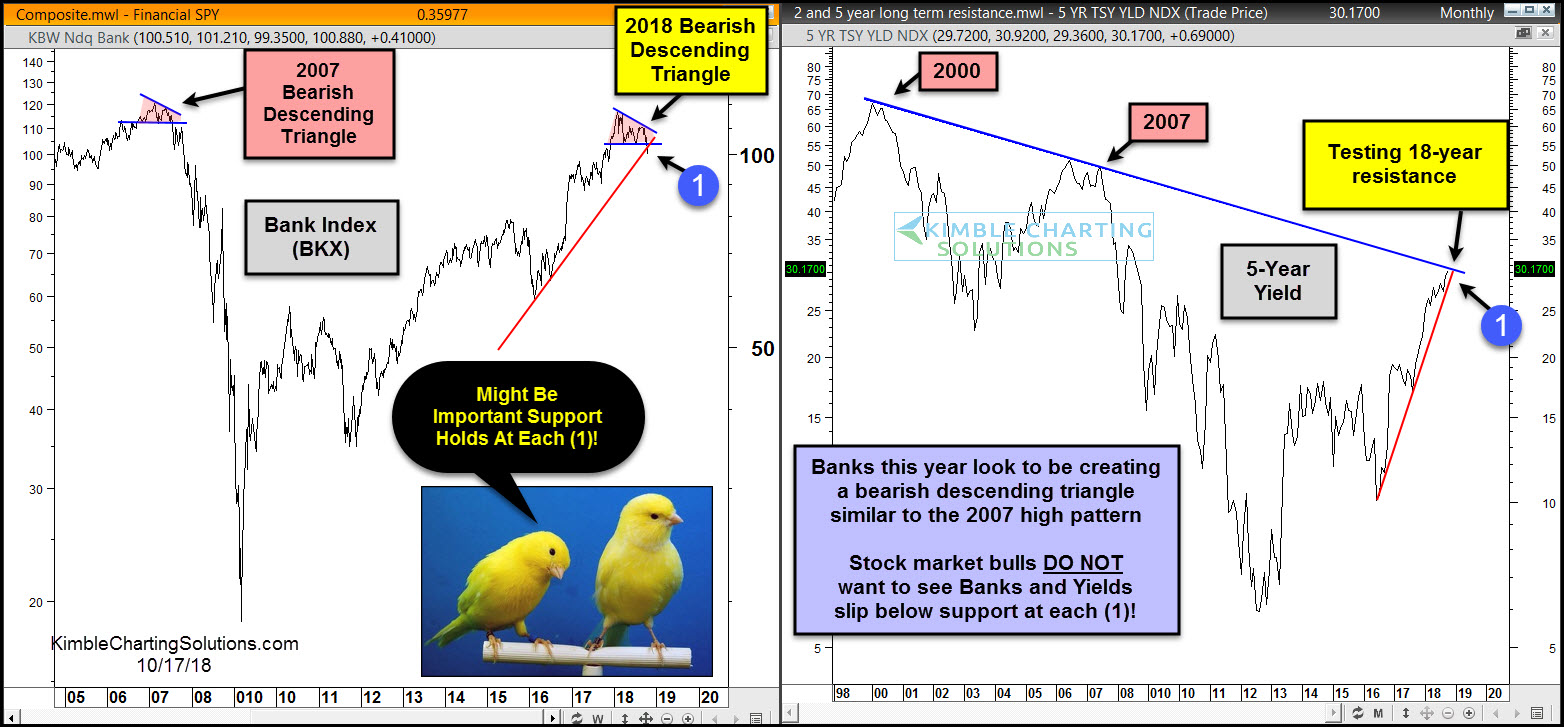
The left chart above looks at the Bank Index (BKX) over the past 13 years. In 2007, the index diverged with the broad market as it was creating a bearish descending triangle. Once support of the descending triangle broke, selling pressure ramped up. This pattern took place while interest rates were actually moving higher, which is often good for banks.
This year, the bank index has been diverging from the broad market while forming a bearish descending triangle. As this divergence is taking place, interest rates are moving higher.
Banks became a 'Canary' at the 2007 highs, sending a caution message to the broad markets before it turned sharply lower. Are banks doing the same thing again this year?
The right chart looks at the yield on the 5-year note. Yields are currently testing 18-year falling resistance. The 5-year yield made important highs back in 2000 and 2007 along this line.
If banks and yields break support at each (1), it will send a caution message to the S&P 500.
