The U.S Department of the Treasury currently forecasts that the national debt will reach the $25 trillion mark by the 3rd quarter of 2020. That’s just two and a half years from now.
What is $25 trillion among American friends? If you combine the debts of every other sovereign state on the planet, you still do not reach $25 trillion. Our nation is a serial debtor.
It is easier to dismiss the enormity of the obligation when government is capable of servicing it through ever-lower borrowing costs. Rising rates, however, alter the debt servicing narrative. Specifically, paying back the interest on the monstrous burden takes a bigger and bigger bite out of how much government can spend elsewhere.
Investors may feel that they can ignore the longer-term implications of their government accumulating trillions in annual deficits. After all, most still regard U.S. Treasuries as the highest quality debt one can acquire. On the other hand, investors are not currently appreciating the near-term ramifications for corporate profits, household spending or asset prices.
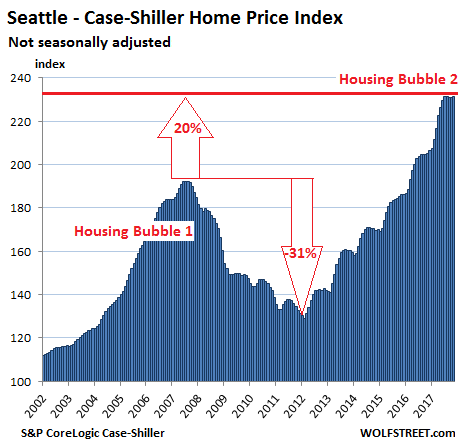
Consider residential real estate — an asset that pole vaulted through the proverbial roof on the back of 30-year fixed mortgages at 3.5%. That rate today is closer to 4.5%, and climbing.
What does this mean for the household looking to buy in Redmond, Washington? A $500,000 mortgage that had been costing $2245 per month now costs $2533 – nearly $3500 more per year. That puts a bit of a dent in the family budget.
Now consider what happens if rates continue to rise. If the 30-year fixed mortgage moves up to 5.5%, the $500,000 obligation that had been costing $2245 per month would cost nearly $2840. That’s close to $600 more per month or $7200 more per year.
How might a 26.5% jump in mortgage expense hamper household spending elsewhere? How might that impact the ability and/or desire for the household to buy the home in Redmond, Washington at all?
Rising rates eventually weigh down consumption in our consumer-based economy. Equally troubling, rising rates would reduce the demand for real estate such that elevated home prices would likely fall in value. Flat or falling home prices do not benefit an economy that has largely benefited from a central bank-engineered “wealth effect.”
One might argue that wage gains and lower tax brackets offset some of the concerns associated with higher borrowing costs. The problem with that assertion? It disregards both the quickening in the erosion of purchasing power (inflation) as well as the American addiction to credit.
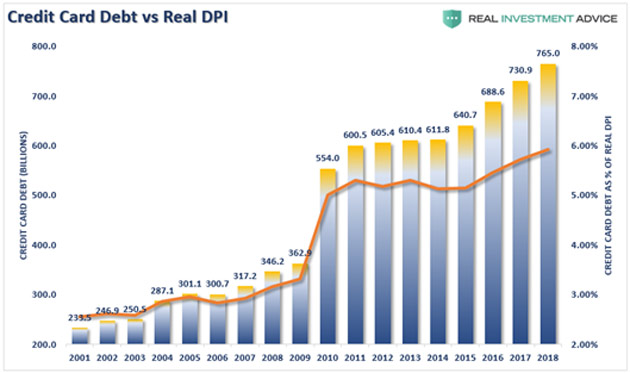
In the chart below, credit card debt is plotted alongside inflation-adjusted disposable income. Not only did credit card debt as a percentage of real disposable income skyrocket after the financial crisis, it remained elevated throughout the recovery from the Great Recession. And over the last few years, it has bumped up even higher toward 6%.
Maybe Americans have been feeling confident that they can spend money that they do not have, especially with wages as well as asset prices on the upswing. Or maybe they have already spent the bulk of their personal savings such that they do not have another choice.
In the graphic below, we see that inflation-adjusted savings as a percentage of disposable income (DPI) has dropped to levels not seen since shortly before the financial system collapsed in 2008. Real savings as a percentage of DPI is historically low as well.
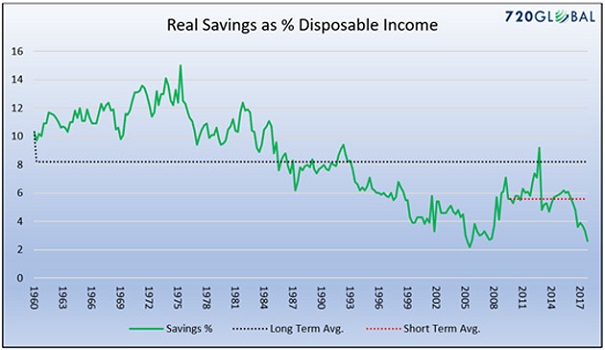
Taking both charts into account, the average American’s credit card balance as a percentage of real disposable income more than DOUBLES real savings. In what universe is that beneficial? Not one where the cost of borrowing is increasing.
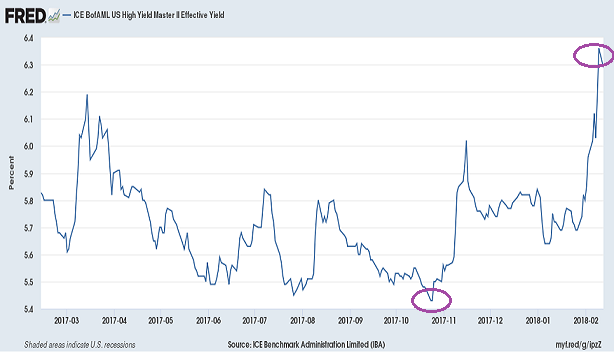
Let’s turn our focus to the bond and stock markets. Non-investment grade corporations could borrow at roughly 5.4% just three months ago. Today it is closer to 6.4%. Corporations, then, will have less money left over for all of the other aspects of their businesses; servicing debts will require more and more of the revenue that they generate.
Again, one might choose to focus on the benefits of tax reform alone. Yet, what tax cuts “gaveth,” higher borrowing costs “taketh” away. The result is a trade-off, and not one that is necessarily favorable to stock valuations.
Consider Forward Price-to-Earnings estimates as we headed into 2018. While those elevated P/E ratios had taken into account higher earnings per share based on the tax overhaul, they did not take into account significantly higher borrowing costs that might exist 12 months later. Many bank economists at the start of the year expected to see the 10-year yield in and around 2.85%-2.90% at the end of the year. We’re already there. Meanwhile, analysts have not exactly slashed their earnings picture or adjusted “cost-of-capital” valuation models.
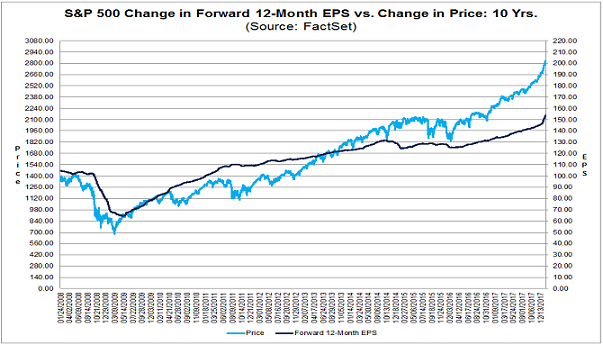
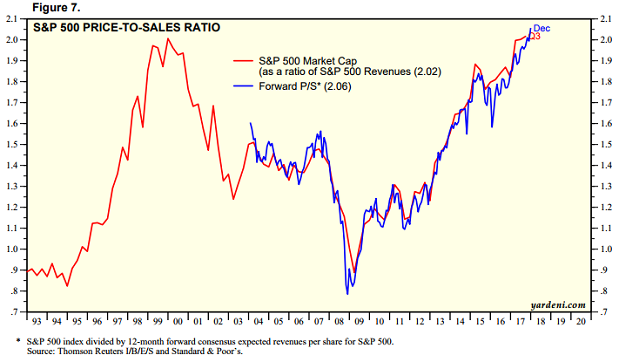
Put another way, if low rates are not nearly as low as they were before, do they still justify stocks trading in the 96th- 99th percentile of historical valuations on a bevy of measures? When does the higher cost of capital make the highest market-cap-to-GDP and highest price-to-sales ratio(s) in history relevant again?
Take a look at forward price-to-revenue in the chart below. That was BEFORE 10-year yields climbed from 2.3% to 2.9%. Maybe, just maybe, higher borrowing costs will make current S&P 500 valuations look quite ludicrous in a rear-view mirror.
To reiterate, borrowers at all levels (i.e., household, corporate, state government, federal government) will be dealing with higher rates in the near-term. The reasons for those higher rates involve everything from extraordinary fiscal stimulus via trillion dollar deficit spending, significant changes to the tax structure, an increase in Treasury bond supply, central bank quantitative tightening (QT), a decrease in Treasury bond demand from other countries as well as inflationary pressures.
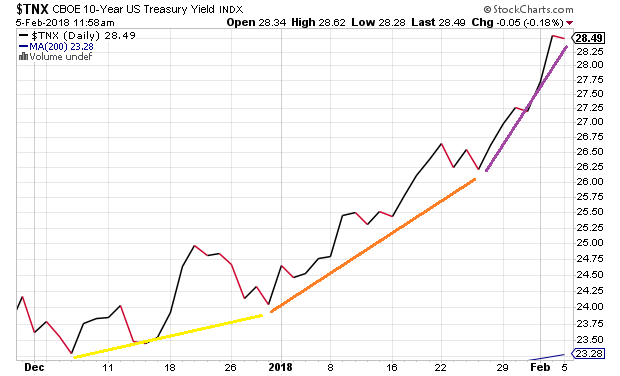
Investors may be unprepared for the ways in which debt, deficits and higher rates can hamper the economy; they’re certainly unprepared for what can happen to the corporate bonds and stocks that they’re invested in. After all, most were caught completely off guard by the speed at which rates were climbing and the ripple effects in the volatility space. (Note: The 10-year has hit 2.90% as I type.)
At present, the S&P 500 is reclaiming roughly half of its correction losses. Relief rallies are common in many 10%-plus pullbacks.
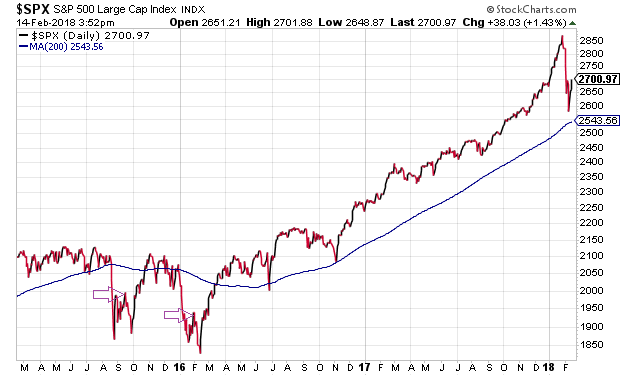
Nevertheless, the headwind of higher borrowing rates may make it very difficult for stocks to solidify longer-term bullish momentum. Phenomenal corporate earnings may not be enough when prices have gotten so far ahead of themselves.
What should investors look for before believing the bull? The day when Federal Reserve members cry, “Uncle.” In particular, Jerome Powell and his Fed colleagues will eventually be forced to backtrack on rate policy.
Perhaps more tantalizing, there will come a time when the Fed will reverse course altogether, implementing actions that push the 30-year fixed rate mortgage down to 2%. That may not happen until the next recession, but it’s an opportunity to start preparing for today.
