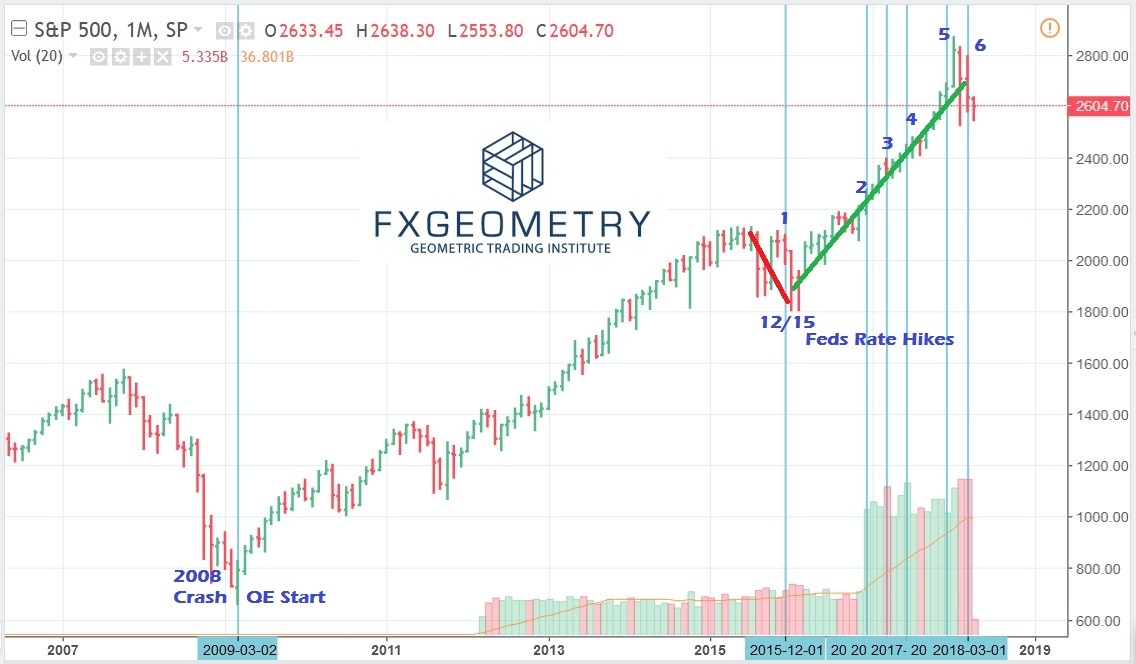
I was among those who were slaughtered when we thought the market had topped back in the Fall of 2015. It was the first time FOMC rumored to raise the Feds rate since 2009; when near zero rate was introduced to kick start the US economy after the crash of 2008. After that first hike in December, instead of diving down further, the SPX soared in the first quarter of 2016 for more than 800 points despite five hikes - Dec 2015, Dec 2016, Mar 2017, June 2017, Dec 2017 - in a little over two years. This is not counting the recent hike last month.
Is the same situation going to be repeated or are we going to have a decent correction when tech stocks recently routed; to saw the SPX dipped more than 300 points in 2 weeks?
The sudden dive raised an alarm among bankers and ex-banker alike, as we know that dealers have to unwind their short to absorb the other side. Could the 'smart money' is shifting their funds to other asset classes as we speak?
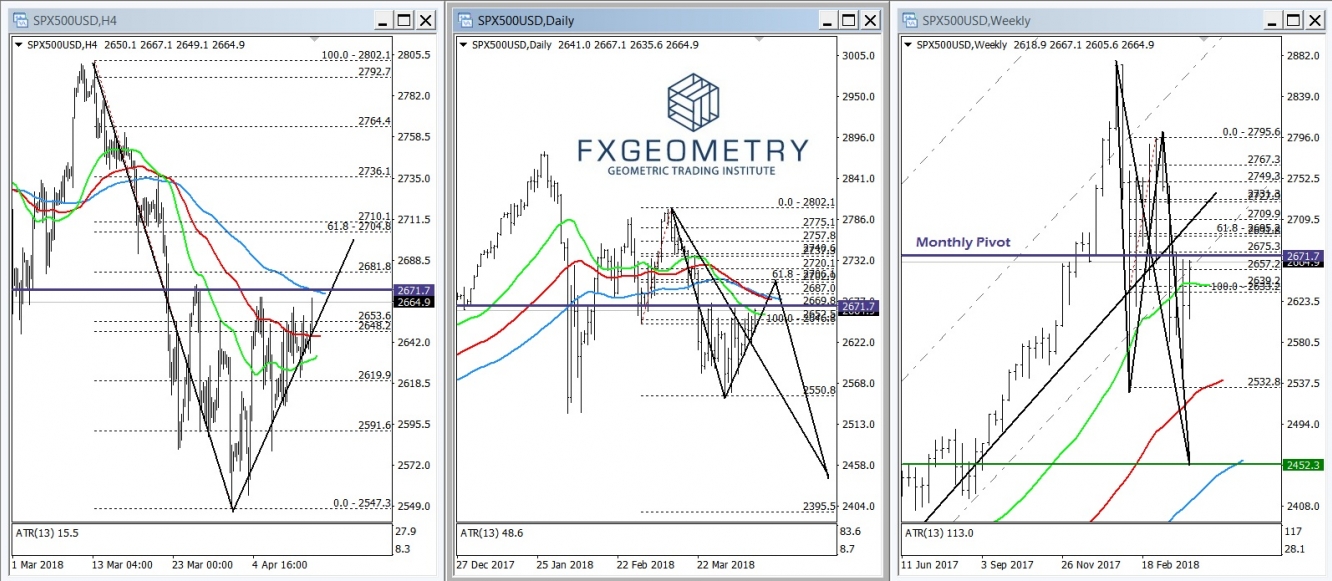
Looking the SPX chart above, the weekly swing failure is obvious and already on the way to the first target circa 2532.80. The daily swing failure, though less obvious, already hit fist target circa 2550.80 and on the 4H, our geometric pattern ABCD is in the making. We may have a rebound to as high as the 61.8% retracement circa 2704.80; though the monthly pivot may prove to strong a resistance to overcome given current market sentiments.
Now this sudden shift in market capitalization has to go somewhere as the money couldn’t just vanished out of thin air (though central banks can create money out of thin air). The wealth must go somewhere either as cash or parked into other asset classes.
If smart money is expecting troubled times ahead, we could not help but see an increased demand in safe-havens especially gold proxy currency like Aussie, Rand and traditional safe-haven gold. It could also be transferred to a newly created asset like cryptocurrencies.
Let’s take a look at the demand in physical and paper gold.
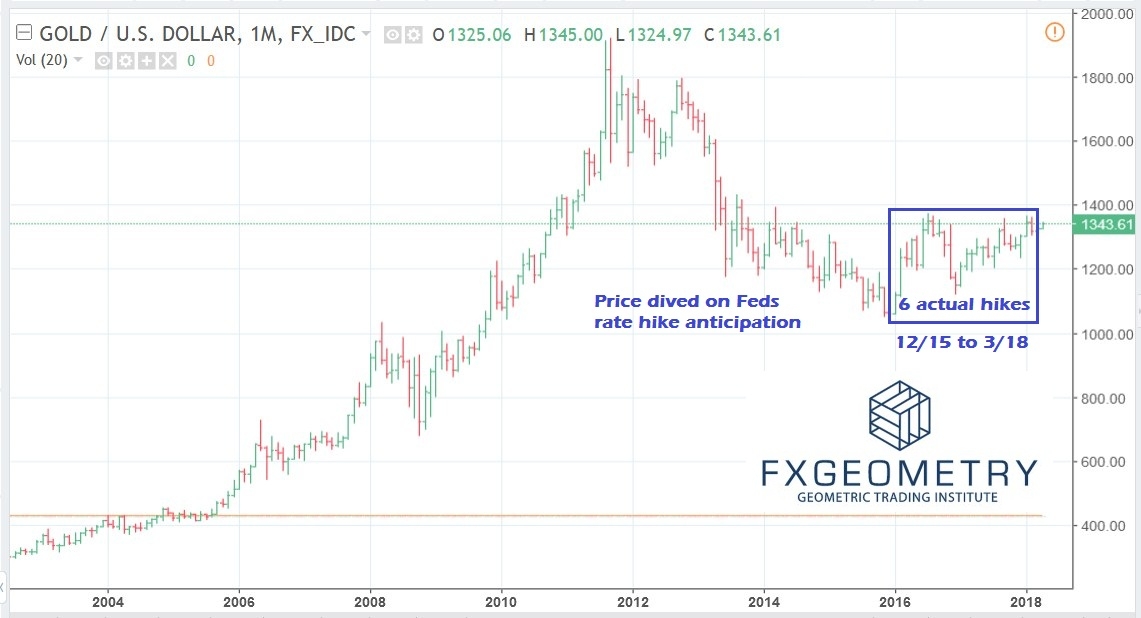
Above is the spot gold chart we all are familiar with, showing how gold dive from as high as $1,920s to almost $1,050s on anticipation of Feds rate hike. Price then ranged between $1,050s and $1,370s during 6 hikes since the first one in December 2015.
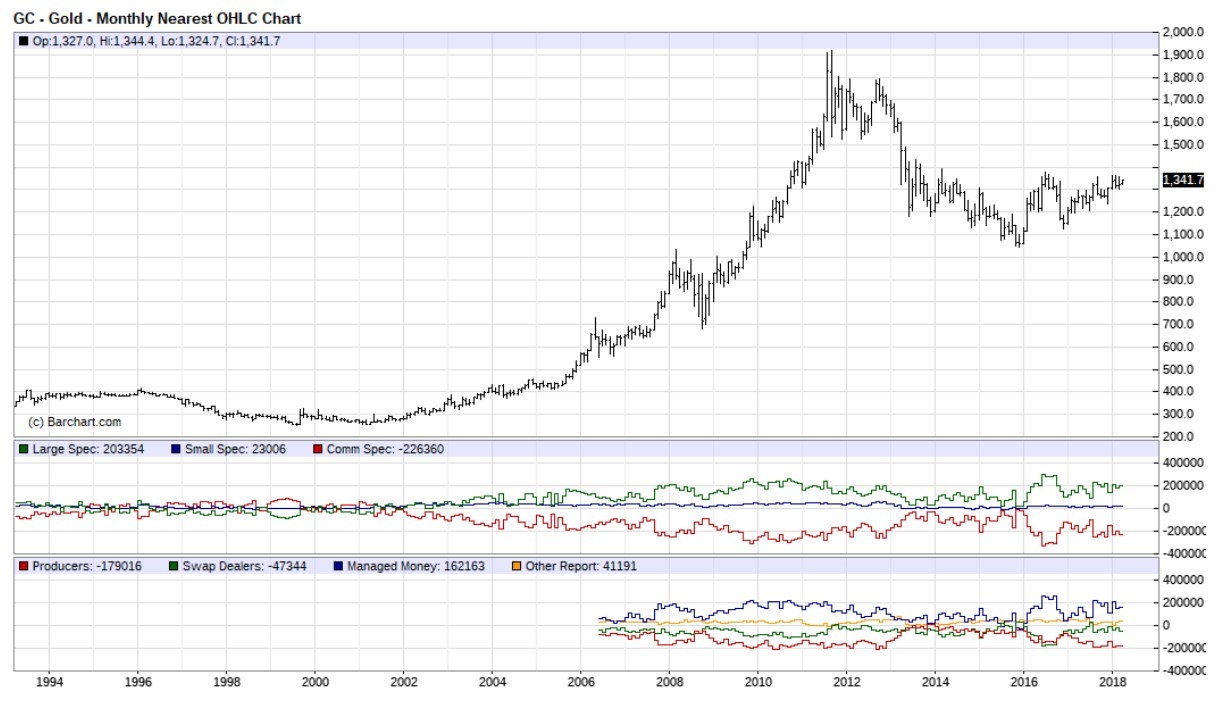
Similarly, the gold futures market depicted pretty much the same picture as below:
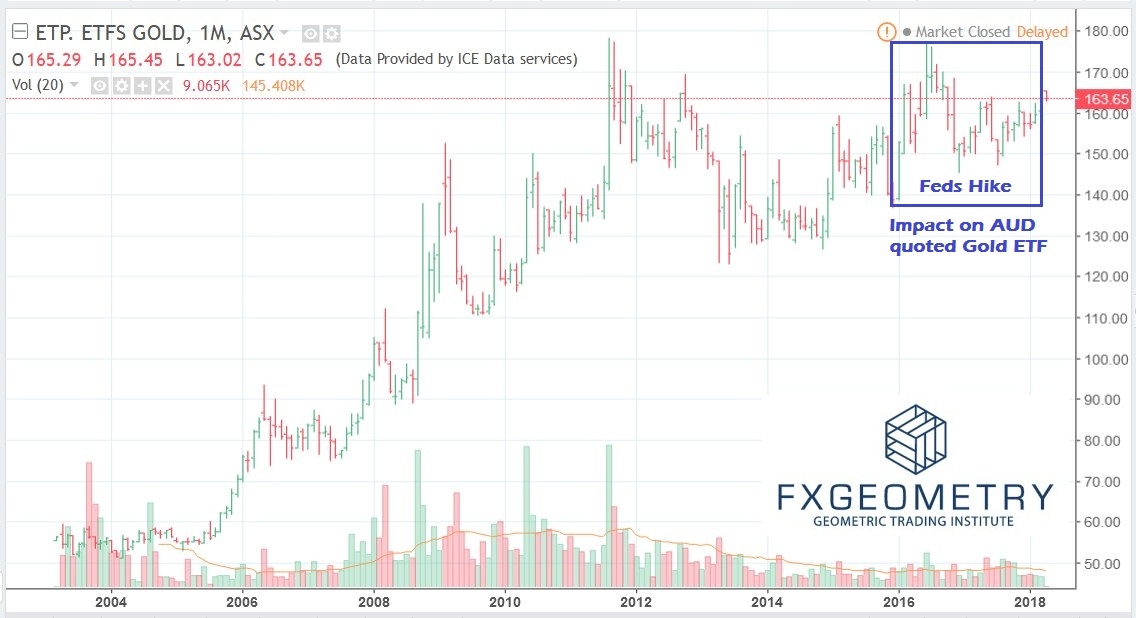
Interesting enough, the physical gold market told a different story
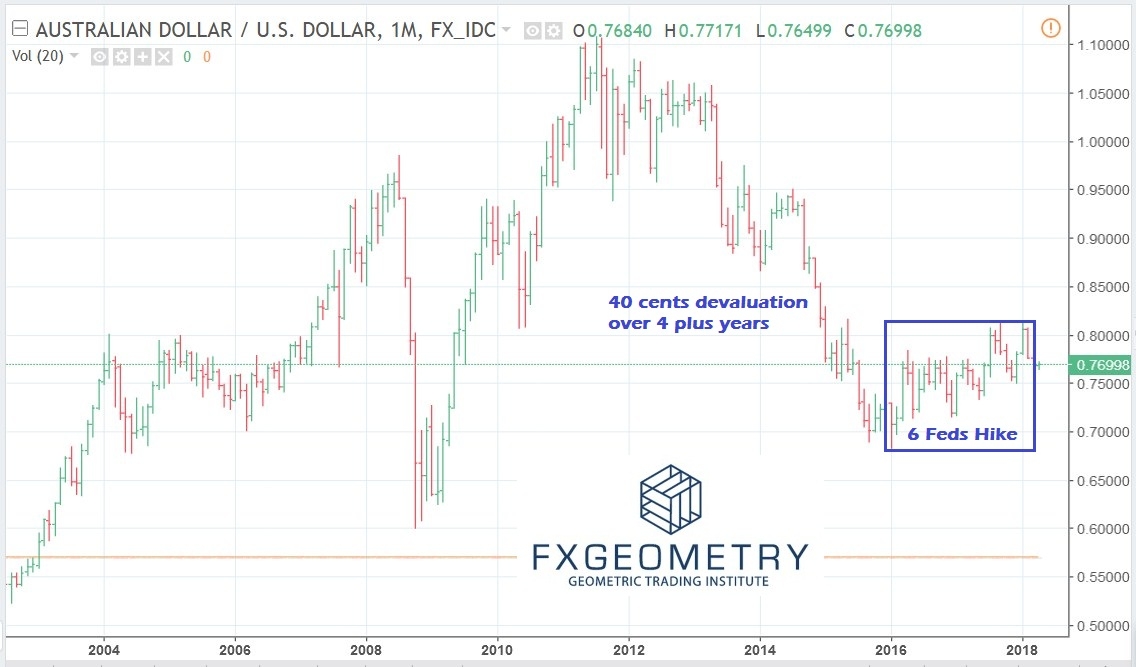
Above is physical gold backed ETF priced in Aussie Dollar (yes, you need AUD to buy that asset) traded at the Sydney exchange. As we can see, physical gold refused to be devalued, hence something else must be devalued or created for the wealth transfer. Check the Aussie chart below:
Yes, gold is made artificially cheaper for dollar holders and this is done through the daily fixing at London Metal Exchange instead of market pricing through open auction. For this very reason, large speculators (the green line in the gold futures chart) have never ever turned net short in their futures contract since QE started, because they know gold is undervalued. The question is, which gold would you rather hold? Paper gold or real gold? or maybe some cryptos?
By: Abdul Jaffar
A retired banker graduated from New York University’s Stern School of Business, with more than 15 years of financial market experiences. A private investor in the equity and commodities markets, Abdul enjoys reading, travelling and writing. His first book “Trading Kit Series - The Road Map” was reserved for prop trading start-up. Now onto writing his second book, “The New Millionaire”, Abdul would talk about the newly minted bitcoin millionaires and their experiences in dealing with the newfound wealth.

