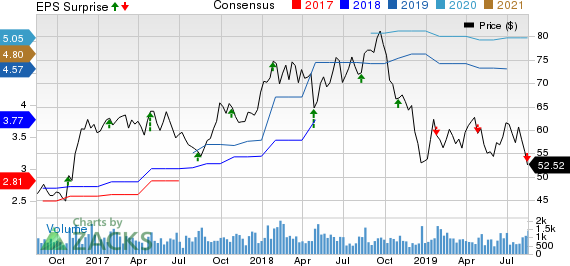
Applied Industrial Technologies, Inc. (NYSE:AIT) has reported weaker-than-expected results for fourth-quarter fiscal 2019 (ended Jun 30, 2019). Its earnings lagged estimates by 14.29% while sales missed the same by 4.5%. The company witnessed poor bottom-line performance for the third time in a row, with a negative earnings surprise of 0.85% recorded in the last reported quarter.
In addition to the quarter’s result, Applied Industrial has announced that it signed an agreement to acquire Olympus Controls Corp.
Despite the buyout announcement, we believe that poor performance weakened investor’s sentiments. The company’s share price declined 0.47% on Aug 15, closing the trading session at $52.52.
Going by figures, earnings in the fiscal fourth quarter were $1.02 per share, lagging the Zacks Consensus Estimate of $1.19. Also, quarterly earnings declined 1% from the year-ago quarter number of $1.03 on weak sales performance.
For fiscal 2019, the company’s earnings were $4.41 per share, reflecting an increase of 17.9% from the previous fiscal year.
Weak Fluid Power & Flow Control Segment Lowers Revenues
In the reported quarter, Applied Industrial’s net sales were $882.7 million, reflecting a year-over-year decline of 1.7%. The results were adversely impacted by a 2.7% fall in organic sales (adjusted for days), 0.4% from forex woes and 0.8% from selling days, partially offset by 2.2% gain from acquired assets. The company noted that top-line results suffered from end-market challenges, especially in fluid power technology.
Also, Applied Industrial’s top line lagged the Zacks Consensus Estimate of $925 million.
The company reports revenues under two market segments. A brief discussion of the quarterly results is provided below:
Service Center-Based Distribution’s revenues totaled $629.1 million, representing 71.3% of net revenues in the quarter under review. On a year-over-year basis, the segment’s revenues grew 1.4% on gains of 0.5% from organic sales and 2.2% from acquired assets. However, these were partially offset by 0.8% adverse impact of selling days and 0.5% from forex woes.
The Fluid Power & Flow Control segment generated revenues of $253.6 million, accounting for roughly 28.7% of net revenues in the reported quarter. Its sales dipped 8.5% year over year due to 9.8% decline in organic sales and 0.8% adverse impact from selling days. Acquisitions, however, had a positive 2.1% impact.
For fiscal 2019, the company’s net sales were $3,472.7 million, up 13% from the previous fiscal year.
Operating Margin Improves Y/Y
In the reported quarter, Applied Industrial’s cost of sales declined 1.4% year over year to $625.4 million. Cost of sales was 70.9% of the quarter’s net sales. Gross margin was down 30 basis points (bps) year over year to 29.2%. Inflation was mainly behind the fall in margins while internal initiatives and pricing were reliefs.
Selling, general and administrative expenses (including depreciation) declined 3.9% year over year to $185.4 million. It represented 21% of net sales in the reported quarter versus 21.5% in the year-ago quarter. Operating profit rose 1.6% year over year to $72 million, with margin increasing 30 bps to 8.2%.
Balance Sheet & Cash Flow
Exiting the fiscal fourth quarter, Applied Industrial had cash and cash equivalents of $108.2 million, up 128.3% from $47.4 million recorded in the last reported quarter. Long-term debt was down 3.1% sequentially to $908.9 million.
In fiscal 2019, the company generated net cash of $180.6 million from operating activities, roughly 22.6% higher than $147.3 million generated in the comparable period a year ago. Capital spent on property purchase totaled $19 million versus $23.2 million in the previous year. Free cash flow was $161.6 million, up 30.3% year over year.
Applied Industrial rewarded shareholders with dividend payments, amounting to $47.3 million in fiscal 2019. This amount represents growth of 3.1% from the previous fiscal year. In fiscal 2019, it purchased 192 thousand shares for $11.2 million.
Acquisition of Olympus Controls Corp.
Acquisition of Olympus Controls Corp. will be completed in August 2019. Notably, Olympus Controls is engaged in providing automation solutions related to robotic technologies, motion control and machine vision.
The assets, upon completion of the acquisition, will operate under Olympus Controls’ name.
Outlook
In the years ahead, Applied Industrial believes that demand for its products and solutions will be driven by the use of sophisticated equipment in manufacturing processes, tighter labor force in the industrial market, regulatory requirements and need to optimize the use of plant floor. Also, the buyout of Olympus Controls will be beneficial as it will mark Applied Industrial’s entry into the robotic/machine automation market.
In the near term, Applied Industrial will benefit from its cash generation abilities and cost discipline. However, uncertainties related to the broader industrial cycle remains worrying.
For fiscal 2020 (ending June 2020), Applied Industrial predicts sales growth of (2%)-2%. Organic sales (adjusted for days) are predicted to decline 1-5% while acquisition will benefit sales by 2% and selling days will likely have positive impact of 1%.
Earnings per share for the company are anticipated to be $4.20-$4.50. Interest expenses will likely be $37-$38 million and tax rate will be 25-26%. Free cash flow is anticipated to be $200-$220 million.
Applied Industrial Technologies, Inc. Price, Consensus and EPS Surprise
Roper Technologies, Inc. (ROP): Free Stock Analysis Report
Applied Industrial Technologies, Inc. (AIT): Free Stock Analysis Report
DXP Enterprises, Inc. (DXPE): Free Stock Analysis Report
Graham Corporation (GHM): Free Stock Analysis Report
Original post

