This post was written exclusively for Investing.com
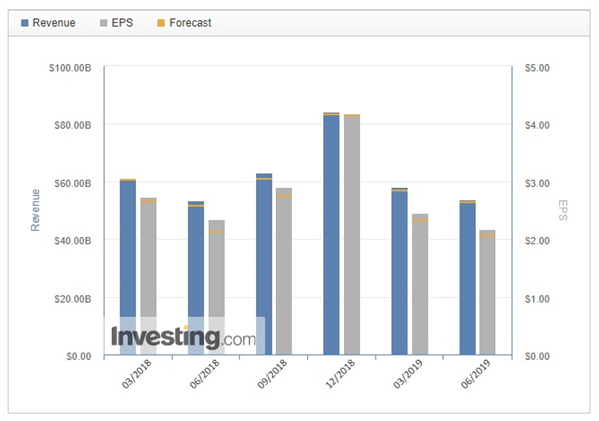
Apple’s 3Q results on July 30 beat expectations on both top and bottom lines, while sales guidance also outperformed estimates. The stock initially jumped after the results, until escalation in the trade war between the U.S. and China damped it down.
However, Apple (NASDAQ:AAPL) is now showing it’s more than a one-trick pony, and that means the stock may rise despite escalating tensions.
Apple’s strong results came in the face of weak iPhones sales and a softening China market. This quarter it was Apple’s wearables and services that were responsible for lifting that heavy load.
As the dependence for Apple’s future revenue continues to transform away from the cyclical nature of selling phones, to a more predictable and linear services model, it is likely to lead to a higher PE ratio for Apple, something that is more in line with consumer services stocks.

The iPhone Business Is Cyclical
The iPhone business has been historically very cyclical with lower gross margins, and as a result, investors have typically been unwilling to pay a high multiple for Apple’s stock. Since October 2015, the stock’s one-year forward earnings multiple has been in a range of 9 to 17.
However, as Apple’s business slowly shifts to that of a more linear services model and away from the seasonality of the iPhone cycle, investors may be willing to pay a higher earnings multiple. It may be the case that is happening right now, with the one-year forward PE ratio: climbing to around 17 currently.
Multiple Expansion
When combining the top 25 stocks that make up the holdings in the Consumer Staples Select Sector SPDR (NYSE:XLP) and Discretionaries (NYSE:XLY), the average PE ratio is 20.5, with a median of 19.9. At a multiple in the range of 20, using analysts consensus estimates for fiscal 2020 of $12.74 per share, Apple’s stock may be worth about $255, almost 25% higher than its closing price of around $204.02 on Aug. 2.
Services And Wearables
In the fiscal third quarter, Apple reported that its services revenue grew by 18% versus last year on a constant currency basis, while excluding a $236 million favorable one item, to $11.5 billion. In total service revenue for the company accounted for more than 20% of Apple’s total revenue of $53.8 billion in the quarter.
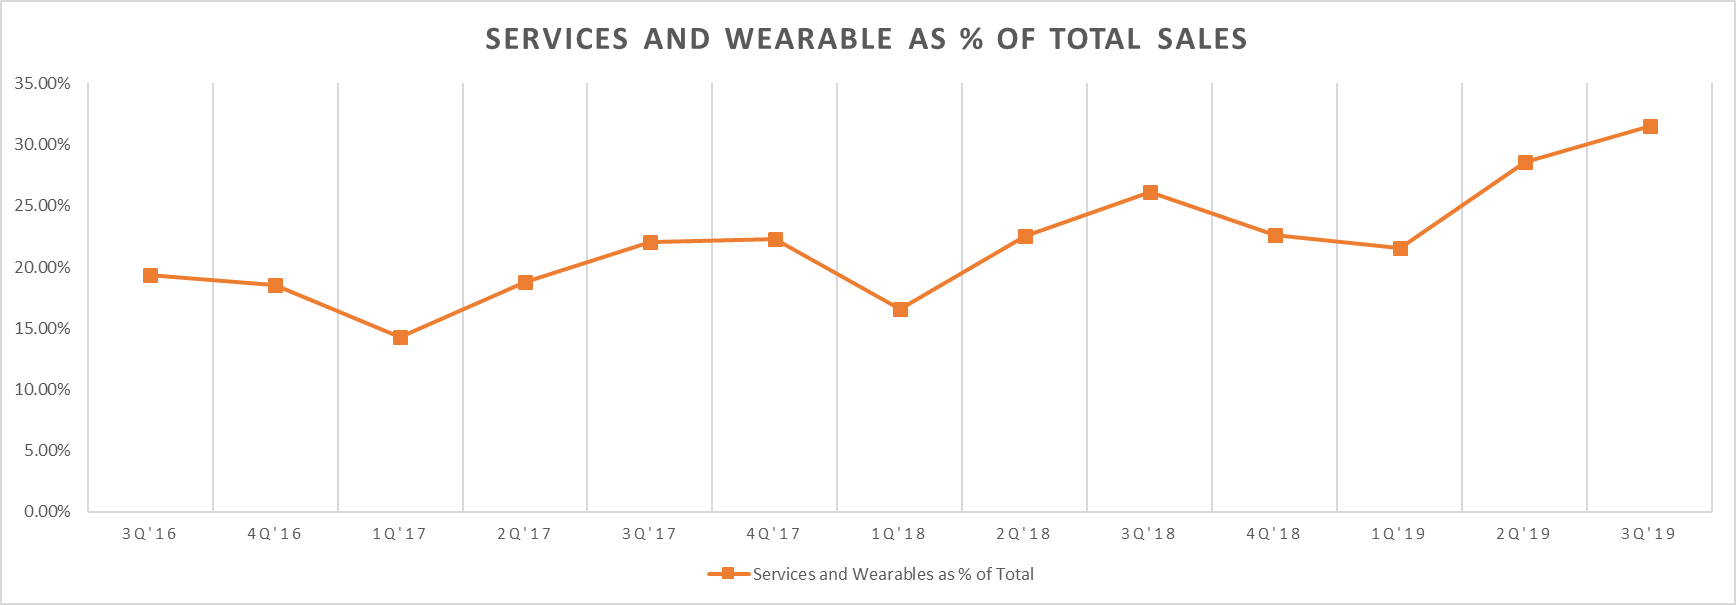
Wearables, Home, and Accessories, was another strong business segment for Apple, with revenue surging by roughly 50% to $5.5 billion from $3.7 billion the year prior. Together, both services and wearables accounted for 31.5% of Apple’s total revenue, its highest level yet.

iPhones Sales Slump
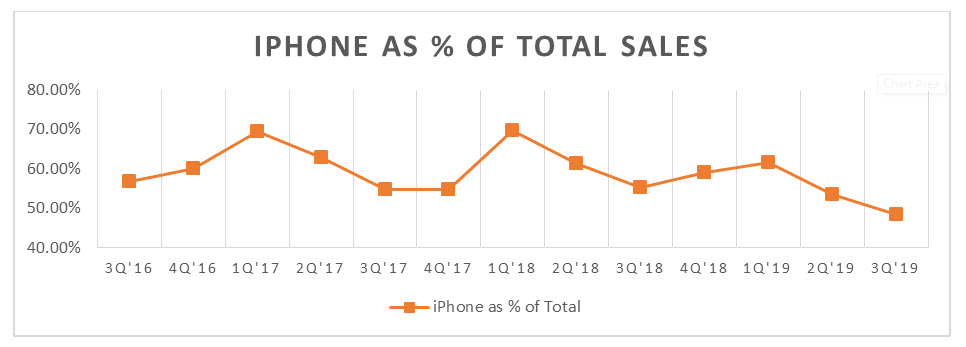
iPhone’s sales represented just 48% of total sales in the quarter, its lowest level since the third quarter of 2016. Additionally, since peaking at roughly 70% in the first quarter of 2018, iPhones sales have been slowly becoming less important to the future of the company.

Should the growth trend for services and wearables continue on their current path, the dependence on iPhones sales will likely continue to decline in the future. That may mean that investors will be willing to pay a higher earnings multiple for the stock.
It seems unlikely that Apple (NASDAQ:AAPL) will ever trade at a PE ratio like some other consumer discretionary stocks in the mid to high 20’s. iPhone’s are undoubtedly a big part of Apple’s business, and that is unlikely to change, which means that margins and revenue will still be suspect to seasonality. But with services and wearables getting progressively stronger, the shares could be in for a significant boost over the next year.
Disclosure: Michael Kramer and the clients of Mott Capital own Apple
Disclaimer: Mott Capital Management, LLC is a registered investment adviser. Information presented is for educational purposes only and does not intend to make an offer or solicitation for the sale or purchase of any specific securities, investments, or investment strategies. Investments involve risk and unless otherwise stated, are not guaranteed. Be sure to first consult with a qualified financial adviser and/or tax professional before implementing any strategy discussed herein. Upon request, the advisor will provide a list of all recommendations made during the past twelve months. Past performance is not indicative of future results.
