US equities are getting oversold again. Roughly a week after the last severely oversold signal (see Time for a market bounce?), I am seeing oversold signals all over the place.
In that post, I highlighted my Trifecta Bottom Model (which uses the SPX as well as VIX:VXV among the indicators), where two of the components had flashed buy signals, which sported a 100% batting average in the last three years. I have marked with blue vertical lines past instances where two of the three components have flashed buy signals and in red vertical lines past instances where all three components have simultaneously flashed buy at the same time.
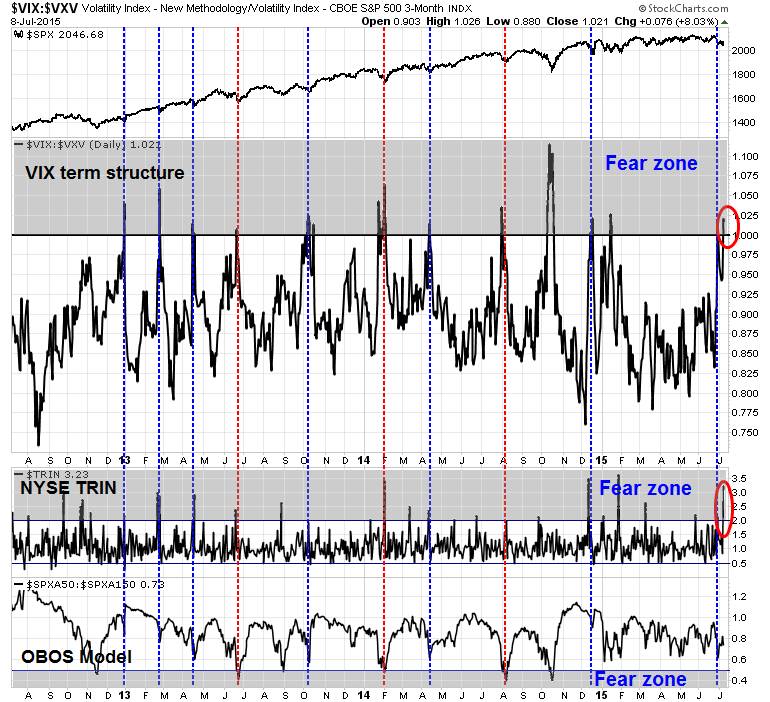
Even though the last signal resulted in a wimpy 1% bounce in the SPX, here we go again with another buy signal a mere six trading days later.
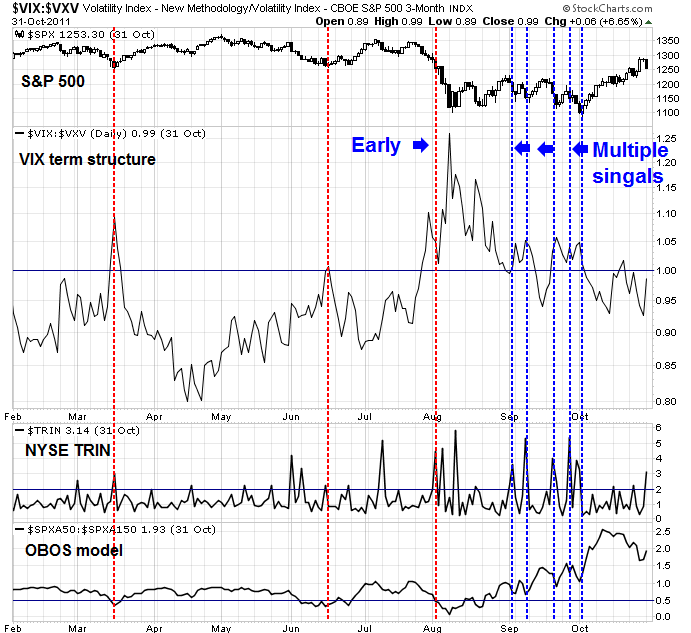
To be sure, I would point out that the Trifecta model is an oversold model. During prolonged declines such as the ones we saw in 2010 and 2011, oversold models don`t necessarily work all the time because oversold markets can get more oversold.
Other signs of an oversold market
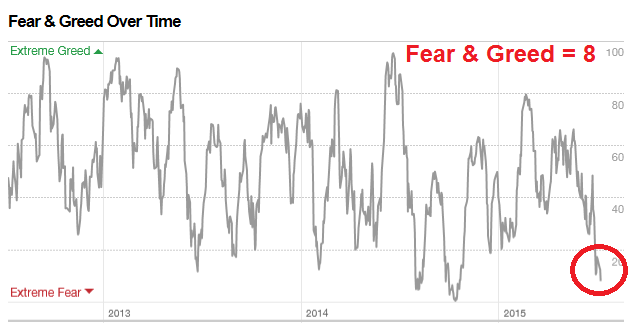
Besides my trusty Trifecta model, I am seeing other signs of a crowded short and oversold market. The CNN Money Fear and Greed Index fell to single digits at a reading of 8, which is a level where the market has bottomed in the past.
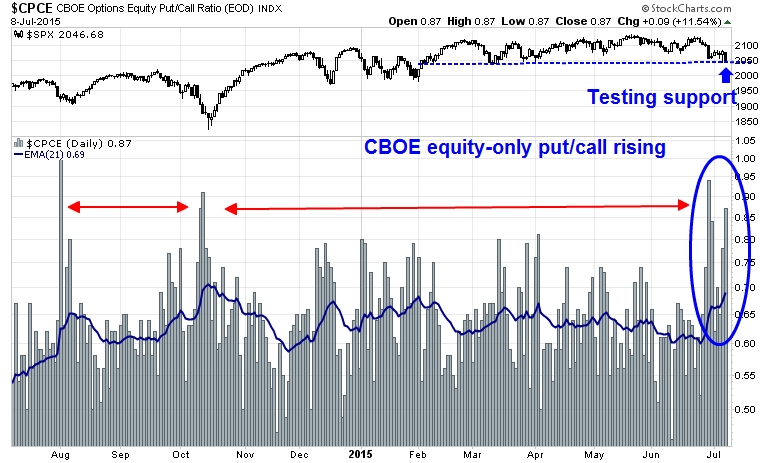
The CBOE equity-only put-call ratio has risen to 0.87, an elevated level indicating excessive fear while the SPX is testing a key support level.
Finally, the chart below of the SPX shows that it breached its 200 day moving average, a key support level. However, RSI(5) is in oversold territory and showing a positive divergence. At the same time, RSI(14) is at the bottom of its 2015 range and stubbornly refuses to get oversold, suggesting that it is nearing a support level and may be due for a bounce.
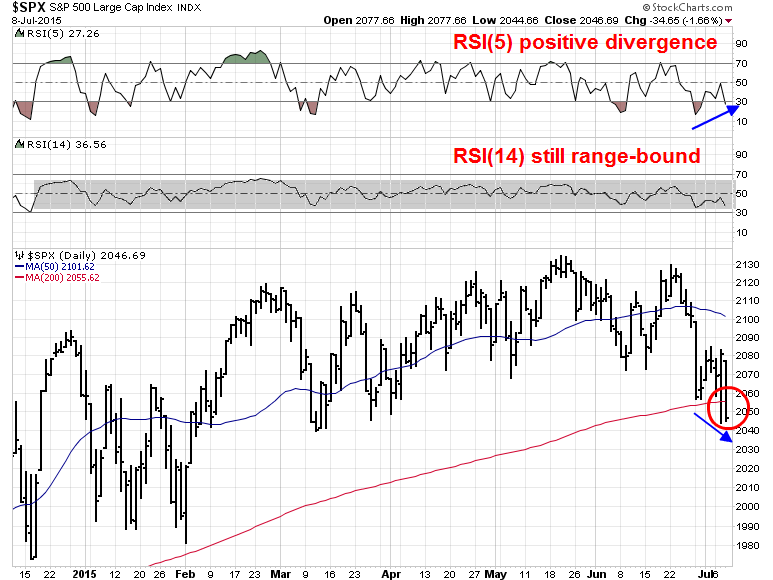
How should we interpret all this? On one hand, the SPX violation of its 200 dma could be construed as a technical break and this could be the start of a cascade pointing to much lower prices. On the other hand, technical and sentiment indicators are flashing oversold signals which suggests that, even if we take the position that the intermediate trend is down, the market may need to stage an oversold rally first before falling further.
In all likelihood, we are on the verge of an oversold rally. Should it occur, the first logical resistance would be the 50 dma at about the 2100 level, but let`s take this one step at a time. Next week is option expiry week, which tends to lend an upward bias to stock prices. On the other hand, we do have the tiny detail that the EU may decide to blow up the Greek banking system this weekend, which is an event which could cause *ahem* a considerable reduction in global risk appetite.
Disclosure: Long SPXL
