The panic-prone bull market in stocks since 2009 has been less panic-prone. The bull turned a bit anxious again last week as Hurricane Irma threatened to level all of Florida after Hurricane Harvey swamped all of Houston and surrounding areas. Irma did lots of damage, but so have previous hurricanes without any consequences for the US economy and stock market. There was also some lingering anxiety about geopolitical tensions with North Korea. However, for now, the US continues to seek nonlethal options, particularly more UN-imposed trade sanctions. Immediate worries about the US federal debt ceiling vanished last Wednesday, when President Donald Trump cut a deal with congressional Democrats to raise the ceiling for three months and agreed to provide emergency funds for Texas and Florida.
When Seinfeld aired on television, millions of Americans viewed the show that was mostly about nothing. Nothing ever happened, which viewers found very entertaining. The bull market has turned into the Seinfeld market. During every episode, investors are watching for something to happen. When nothing does, especially nothing bad, investors are bemused and show their appreciation by throwing more money at the bull. So it’s back to some of the basics that continue to drive the bull market:
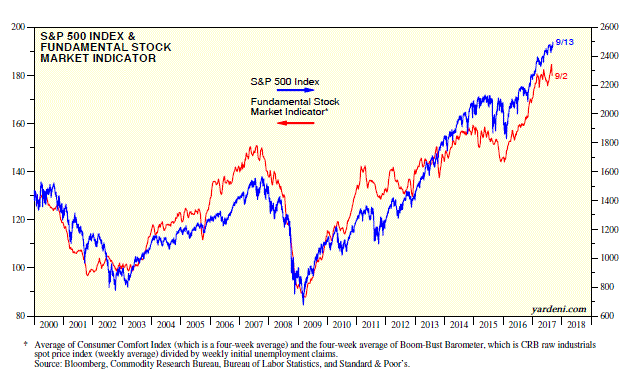
(1) Fundamental Stock Market Indicator. Our Fundamental Stock Market Indicator edged down in early September, but remains in record-high territory. It has been highly correlated with the S&P 500 since 2000. Its two components declined slightly in early September.
Our Boom-Bust Barometer has been rising in record-high territory since late September 2016. It is simply the ratio of the CRB raw industrials spot price index to initial unemployment claims. The commodity index has been moving higher recently, led by the soaring price of copper. Initial jobless claims remain near recent cyclical lows, but rose in early September as a result of Hurricane Harvey, according to the Bureau of Labor Statistics (BLS). It has been highly correlated with the S&P 500 since 2000.
The Weekly Consumer Comfort Index rose at the end of August to a 16-year high, but edged down at the start of September. This index has been highly correlated with the S&P 500 forward P/E since 1995. When consumers are happy, investors tend to be willing to pay more for earnings.
(2) Forward revenues. S&P 500/400/600 forward revenues all rose to record highs last month. Also impressive is that analysts’ consensus expectations for S&P 500 revenues remain remarkably stable at elevated levels, with current estimates implying a solid gain of 5.0% in 2018, following 5.6% this year.
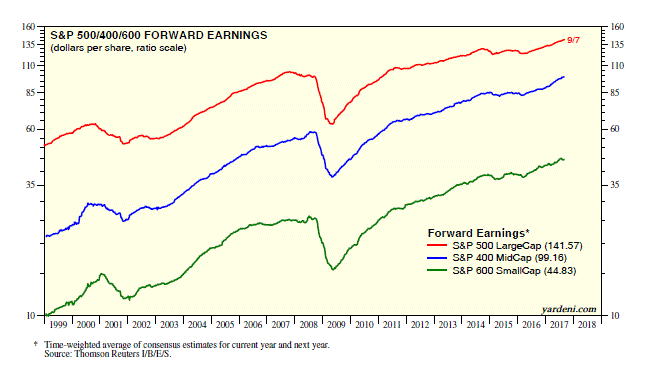
(3) Forward earnings. The forward earnings of the S&P 500/400/600 continue to trend higher in record-high territory. During the first week of September, forward earnings for the S&P 500/400 both rose to record highs. 

