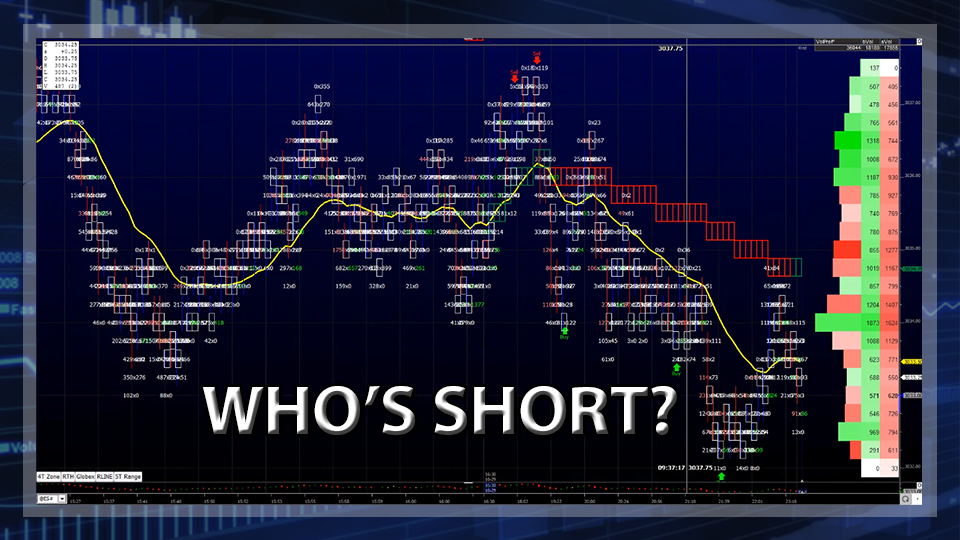
Up, Up and Where???
The S&P 500 futures (ESZ19:CME) closed Tuesday’s session at 3035.75, a few handles below its 8:30 CT opening print at 3034.00, and towards the lower end of its trading range (3029.50 – 3046.25). While it was nice to break another record, the markets are not as “frothy” as they have been in the past when record after record was achieved. There’s no, “it’s going to the moon” bullish consensus out there; that’s a good thing.
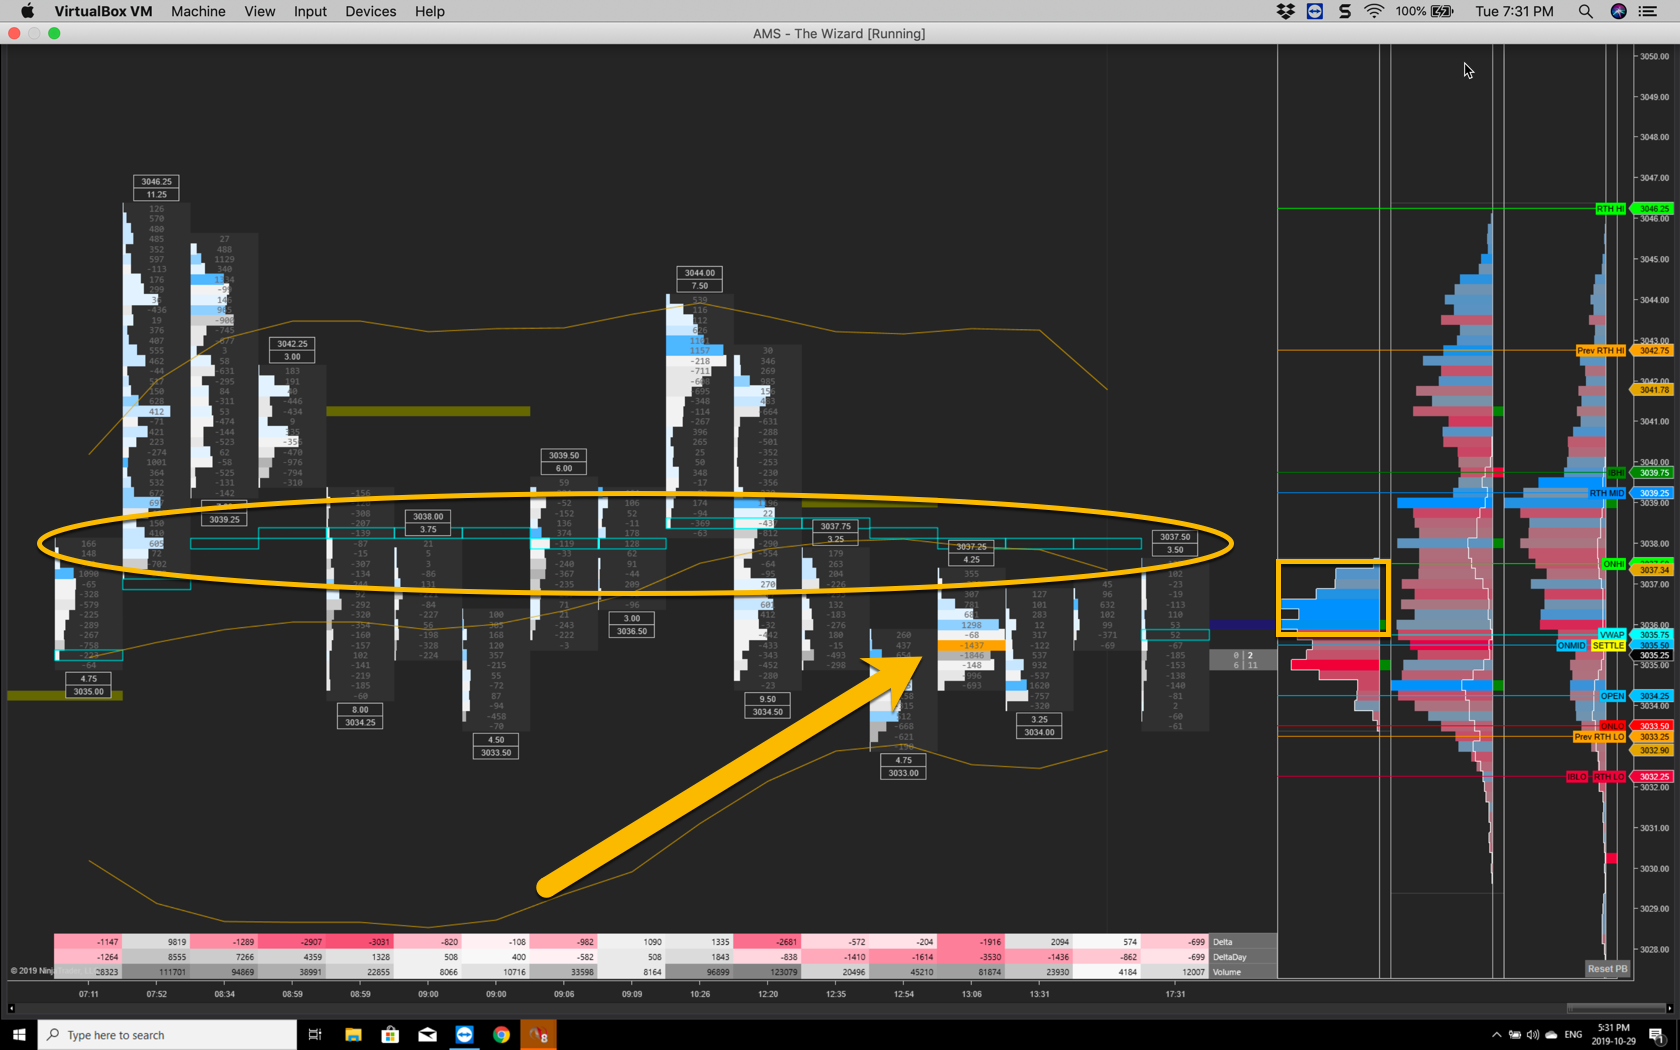
Chart courtesy of AMS Trading Group
Market tops are not usually dramatic; corrections are. When markets top, they more or less “roll over”; a series of lower highs and lower lows accompanied by expanding daily trading ranges, with or without increasing volume. This is not a trader’s market. There are better things to trade than the ES. Today, other than having bragging rights on my natural gas call of last Friday, we’re going to take a look at the U.S. 10-Year Treasury Note.
Interest Rates Tell All
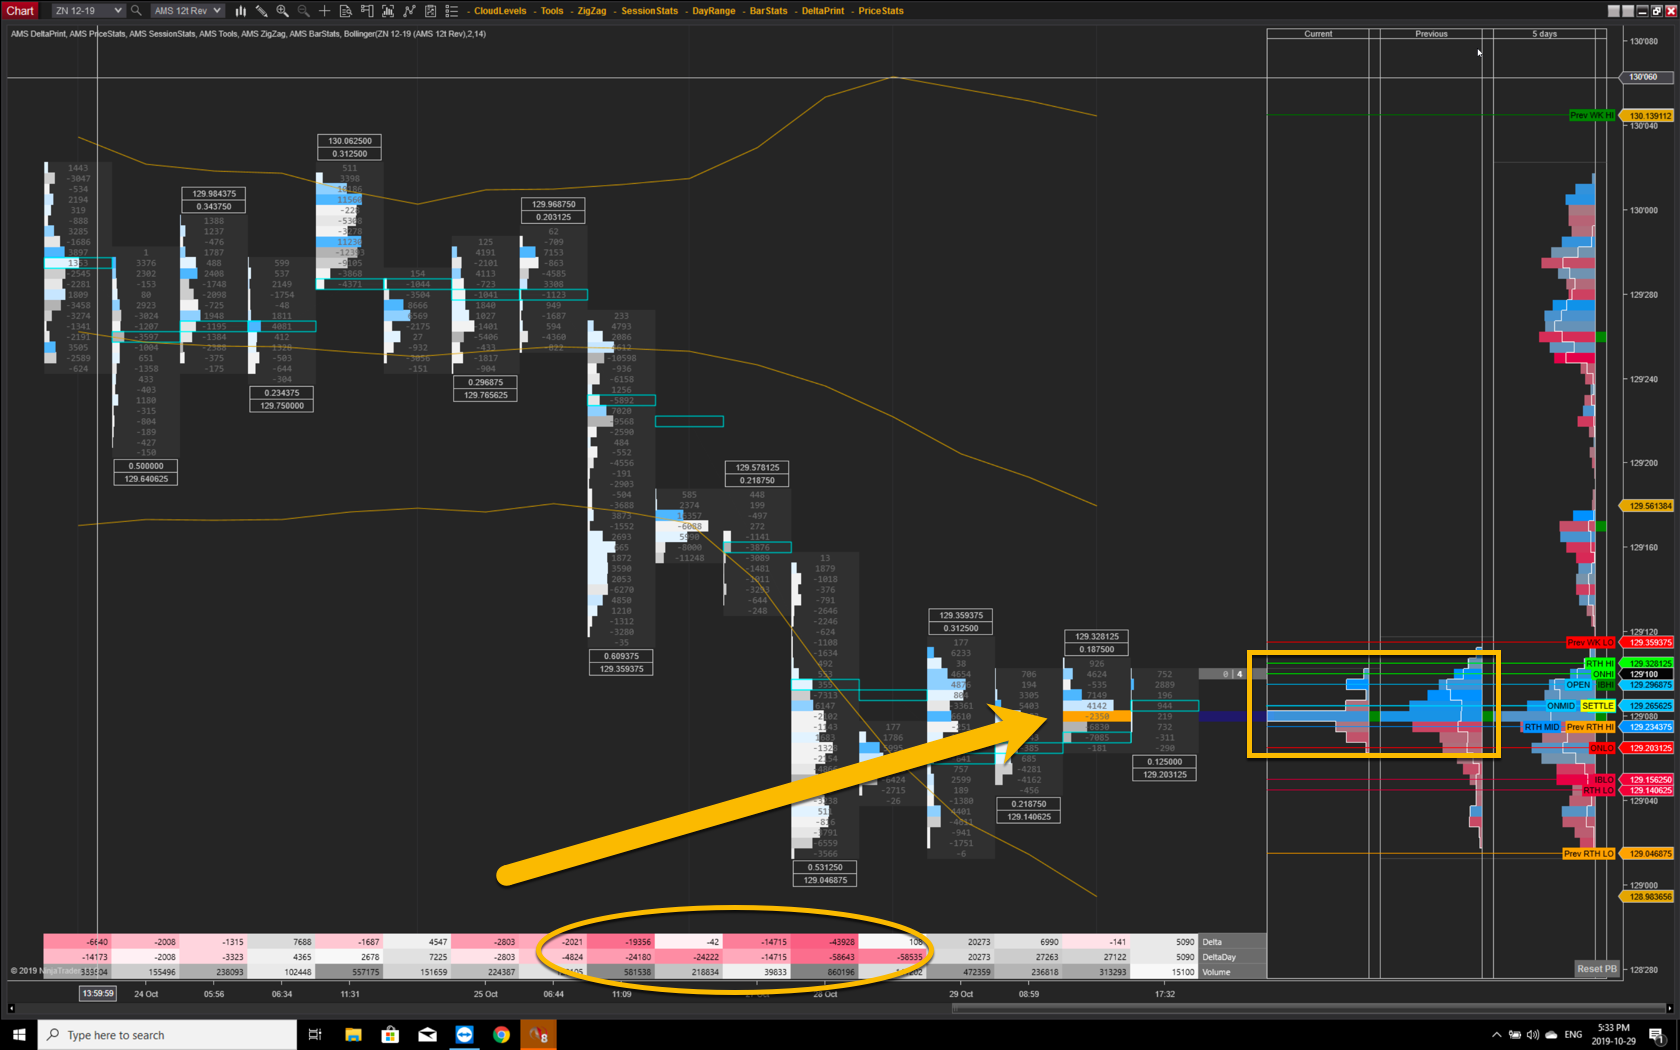
Chart courtesy of AMS Trading Group
Some analysts are calling for another ¼ point reduction in interest rates. As illustrated by the charts, the 10-Year doesn’t reflect that, nor does the need exist unless the Federal Reserve sees what is reflected in the article below.
As before, when I read something that another has posted that is better than I can write, I’ll show it to you. If you’re a bull, I suggest you read it from start to finish. There’s a lot you can learn from the contents of this article.
The Federal Reserve has the 10-Year pegged at 1.75% percent. At today’s close, the future was trading closer to 1.85%. If traders thought the Fed was going to lower rates, you would expect the futures to be trading closer to 1.50%, but it’s not.
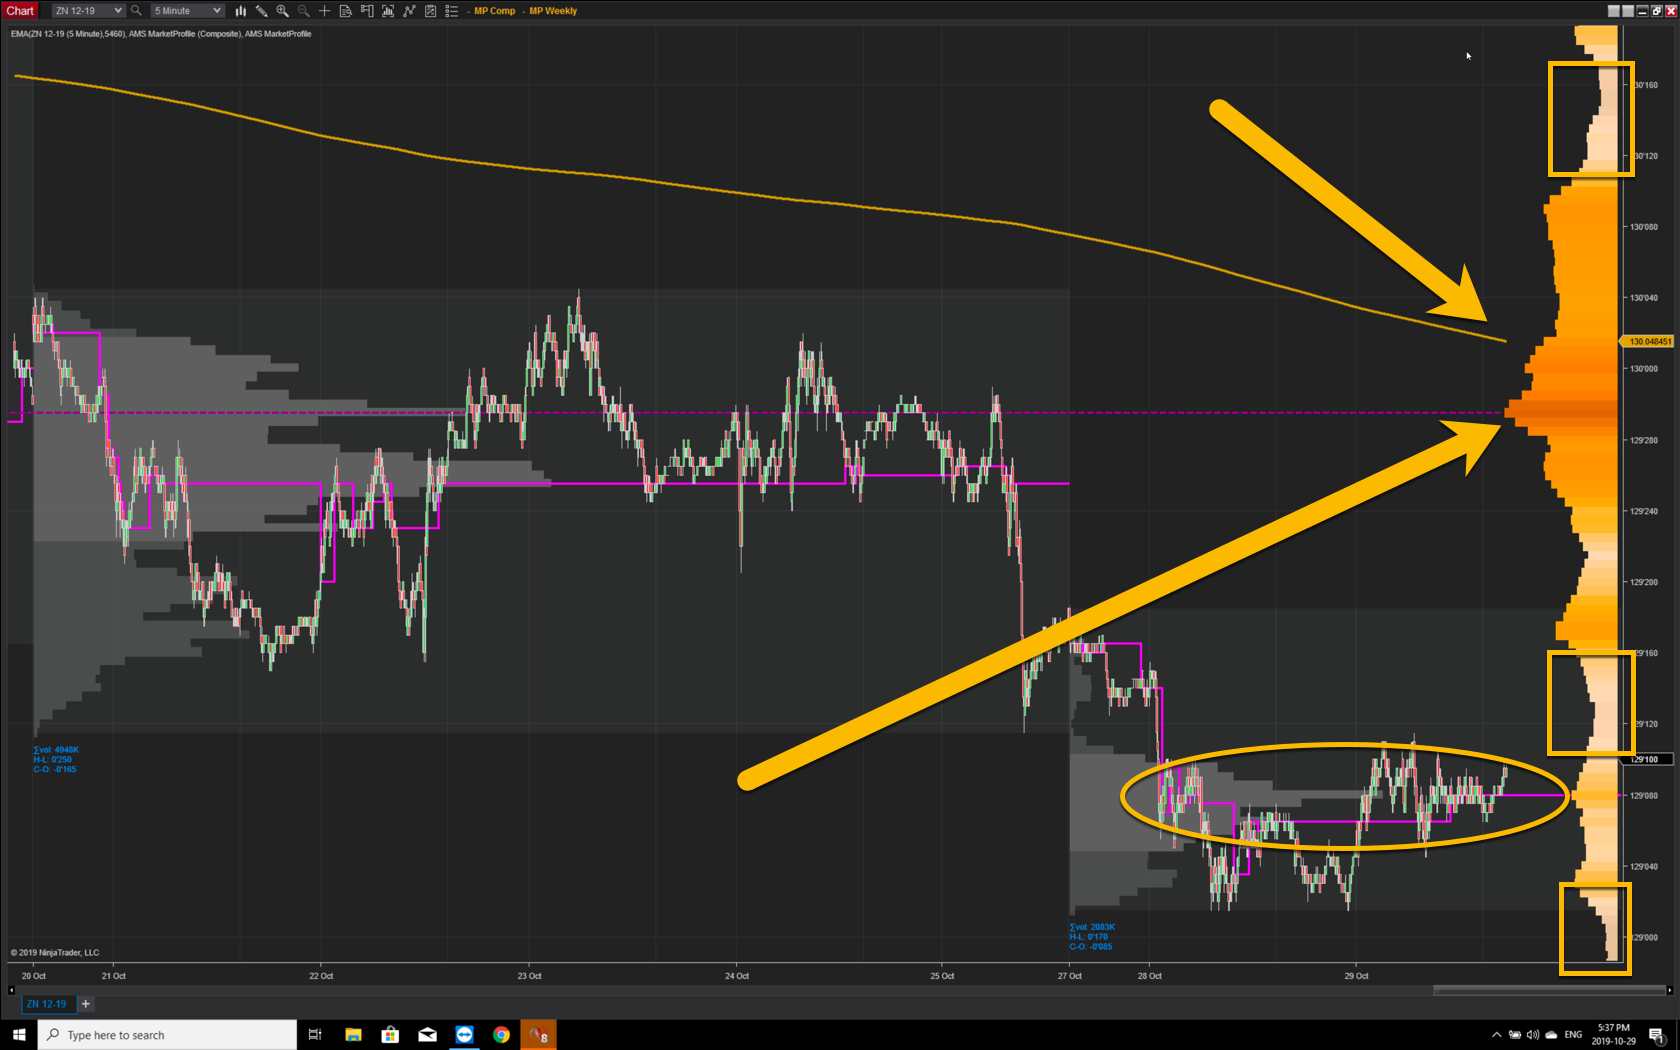
Chart courtesy of AMS Trading Group
Like most futures contracts, there is a tendency to “overshoot.” Obviously, this was the case with the 10-Year, as the world thought interest rates in the U.S. were headed to 1.25%, or lower. The Fed was flooding the markets with money and the China trade issue was a problem.
The China issue, although not resolved, seems to be headed in the right direction. Let’s watch and see if the Fed still floods the market with money at what I call, “repo-time!” My sense is that with the $120 billion injection (the “faux” QE4), they’re done with that exercise too.
Natural Gas Update
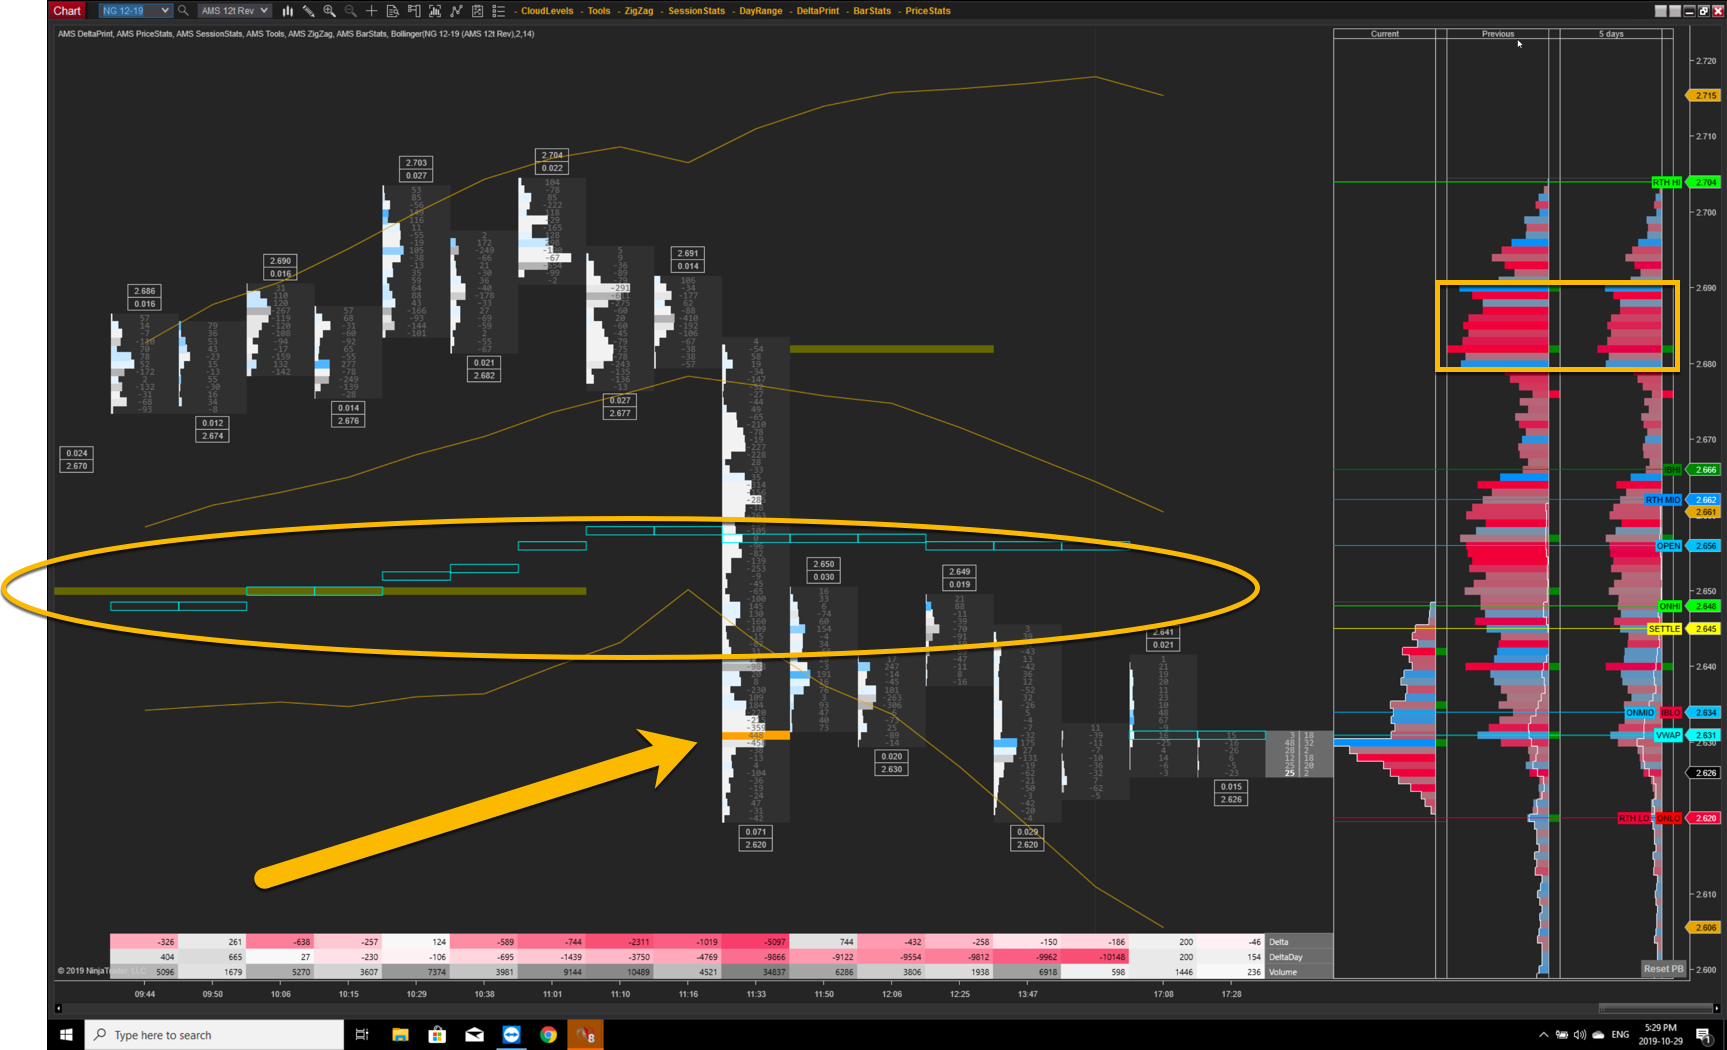
Chart courtesy of AMS Trading Group
Wow, it’s nice to be right. With the weather cooperating, “right” has turned into a great trade (a 40 cent move in only two days). It happens every year, you just have to be patient.
A couple other hints at trading Natural Gas, two critical technical points came into play today; 2.72 and 2.62. I don’t know why, but these seem to be the levels where the traders react. There’s still more natural gas in the ground than anyone can use. Suppliers want higher prices, but with recent consolidation in the industry, overhead costs have been accreted. Don’t get greedy!
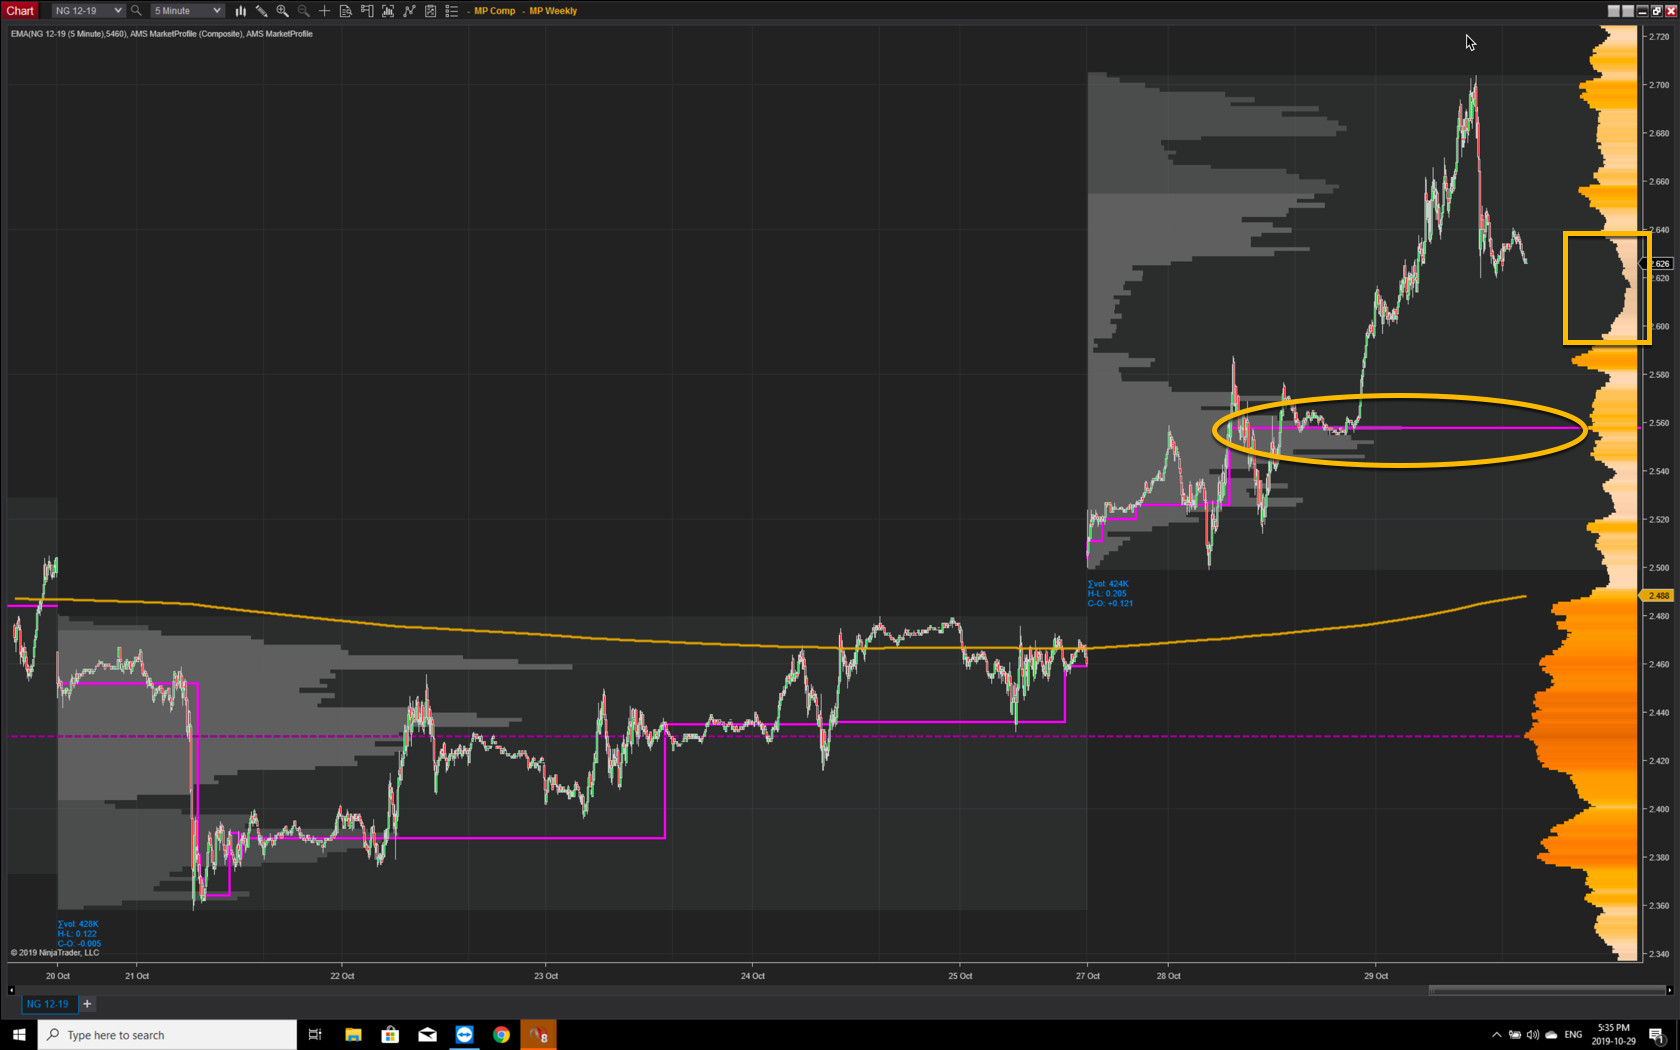
Chart courtesy of AMS Trading Group
Keep Me Posted
Personally, it’s going to be a busy time for me over the coming weeks. After many wonderful years, essentially in retirement, I am returning to the United States from Vancouver Island. After my return we’re going to do our best to “run live” so we can teach using an active AMS screen through TradeChat.
If something of this nature is of interest to you, just let me know. At the same time, let me know what commodities you like to trade. My partner Niels is the expert on the ES, but he can’t always interact while trading live from the Amsterdam Exchange.
