NVDA Q3 Earnings Alert: Why our AI stock picker is still holding Nvidia stockRead More

Another 1000 Points For The Nasdaq 100

Published 11/01/2017, 09:40 AM
NDX
-

The Nasdaq 100 broke out of a Diamond shaped consolidation range in June of 2016. Since then it seems to have done nothing but race higher. So far it has racked up a 1700 point gain since then, almost 40%. Surely it must be running out of fuel right? Well those that follow the fundamentals of stocks will tell you that the recent reports of Nasdaq 100 companies have been smoking hot.

So what is going on with the Nasdaq 100? Does it have more fuel in the tank? One view suggests it is about to fire the next booster rockets. The chart below shows the long term monthly picture of the Nasdaq 100 over the last 20 years. There are two patterns to look at in the chart.
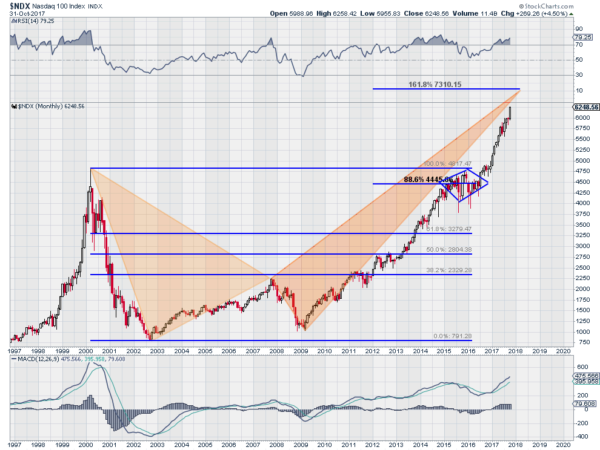
NDX Monthly Chart

The first is the harmonic pattern in the 2 orange triangle. This Crab harmonic triggered on the move out of the Diamond and gives a Possible Reversal Zone (PRZ) above at 7310, a 161.8% extension of the move from the top of the Tech bubble to the low at the start of the century. That is another 1050 points higher.

The second is the Diamond itself. The move into the Diamond, from about 2300, extended to the move out gives a preliminary target to 6600. This might give it pause in the shorter run. Momentum is running strong, but if you look left the RSI and MACD are still no where near the highs reached in 2000. Of course these patterns may fail, but until they do there is room for the Nasdaq 100 to continue to rocket higher.

The information in this blog post represents my own opinions and does not contain a recommendation for any particular security or investment. I or my affiliates may hold positions or other interests in securities mentioned in the Blog, please see my Disclaimer page for my full disclaimer.

Original post

Latest comments

Loading next article…
Risk Disclosure: Trading in financial instruments and/or cryptocurrencies involves high risks including the risk of losing some, or all, of your investment amount, and may not be suitable for all investors. Prices of cryptocurrencies are extremely volatile and may be affected by external factors such as financial, regulatory or political events. Trading on margin increases the financial risks.
Before deciding to trade in financial instrument or cryptocurrencies you should be fully informed of the risks and costs associated with trading the financial markets, carefully consider your investment objectives, level of experience, and risk appetite, and seek professional advice where needed.
Fusion Media would like to remind you that the data contained in this website is not necessarily real-time nor accurate. The data and prices on the website are not necessarily provided by any market or exchange, but may be provided by market makers, and so prices may not be accurate and may differ from the actual price at any given market, meaning prices are indicative and not appropriate for trading purposes. Fusion Media and any provider of the data contained in this website will not accept liability for any loss or damage as a result of your trading, or your reliance on the information contained within this website.
It is prohibited to use, store, reproduce, display, modify, transmit or distribute the data contained in this website without the explicit prior written permission of Fusion Media and/or the data provider. All intellectual property rights are reserved by the providers and/or the exchange providing the data contained in this website.
Fusion Media may be compensated by the advertisers that appear on the website, based on your interaction with the advertisements or advertisers.
© 2007-2024 - Fusion Media Limited. All Rights Reserved.