AT40 = 46.9% of stocks are trading above their respective 40-day moving averages (DMAs)
AT200 = 62.0% of stocks are trading above their respective 200DMAs
VIX = 12.9 (volatility index)
Short-term Trading Call: cautiously bullish (notable caveats explained below)
Commentary
The timetable for a May end to this period of extremely low volatility looks like it is right on schedule.

This historical Trump tweet is a handy reminder that times and circumstances can change in an instant. Bombing Syria does not make sense until it does. Similarly for the stock market, geo-political dangers and economic risks do not matter until they do. I daresay last week’s events brought us incrementally closer to a moment when the market will suddenly care. For now, the sellers STILL lack the firepower and follow-through even as buyers and bulls fail to to reignite lost momentum.
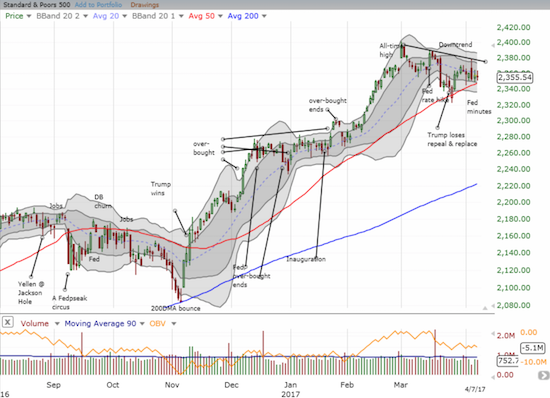
The S&P 500 (via SPDR S&P 500 (NYSE:SPY)) rallied right to its downtrend before the Fed minutes brought the index right back down toward a subtle test of 50DMA support.
The most salient feature of this chart of the S&P 500 (SPY) is the triangle or wedge pattern developing between the uptrending 50DMA and the downtrend from the all-time high. I redrew the line from previous posts to more closely match the closes instead of the highs of the day. This change brings Wednesday’s trading around the release of the Fed minutes into high relief.
This change also demonstrates that the market’s response to the U.S. bombing of Syria barely registered a blip. The downtrend in the 20DMA now runs almost exactly parallel to the downtrend from the all-time high. As long as the index closes above its 50DMA, my bullish call, albeit cautious, stays golden. The bullish call gets confirmation with a breakout above the downtrend.
My trading plan for a close below 50DMA support is a bit more involved. My previous plan was to stay cautiously bullish and look for a true oversold reading to trigger an aggressive bullish positioning. After sellers folded on March 27th, I noted how AT40 (T2108), the percentage of stocks trading above their respective 40DMAs, had achieved “oversold enough” status. The bounce from “oversold enough” is still active given AT40 has not yet hit overbought status.
So, if the S&P 500 takes a tumble from here, AT40 will likely very quickly fall back to the low 30s. I will be very hesitant to flip bearish at that point. As a compromise deference to the current short-term downtrend and increased market risks, I plan to switch to a neutral status if 50DMA support gives way for the S&P 500. Such a trading call will mean that I will abstain from making additional bullish trades until an oversold reading. I will also be extremely selective in making bearish trades – like reaching for put options on Caterpillar (NYSE:CAT).
AT40 and volatility
Speaking of AT40, my favorite technical indicator twisted wildly in the wind last week. AT40 closed the month of March at 49.8%, got as low as 39.7% after the Fed minutes, rallied vigorously on Thursday in a move that was almost another bullish divergence (the S&P 500 barely managed to close flat on that day), and then closed the week at 46.9%.
Most importantly, AT40 failed to hold the previous high from mid-March. So while sellers lack follow-through firepower, buyers are acting like they may be getting a bit exhausted.
The wild swings in AT40 translated into upward pressure (albeit subtle) on the volatility index, the VIX. Volatility ended March at 12.4. On Monday, the VIX briefly broke through its so far tough-to-crack 200DMA. The VIX has failed to close above this trendline since the election.
Yet, the pressure is building and hinting to anyone watching of an incrementally more dangerous market. Ahead of the Fed minutes on Wednesday, the market got quite comfortable with volatility tumbling on Tuesday to 11.8 and then as low as 10.9 right before the minutes. That move MAY have been the final flush of complacency as volatility closed the week at 12.9. If my read is correct, this period of extremely low volatility will come to an end on schedule.
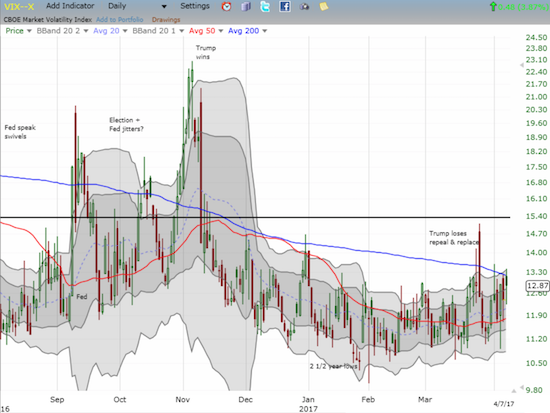
The upward pressure on the volatility index, the VIX, continues to build as its 50DMA starts to turn upward for the first time since September.
Given the apparent changes afoot, going forward, I plan to make sure to have call AND put options in play on ProShares Ultra VIX Short-Term Futures (NYSE:UVXY). In fact, I think trading volatility using AT40 may produce better results than trading the S&P 500.
The impact of April’s release of Fed minutes
The Fed minutes typically have little impact on market trading. Since these minutes seemed to change the tenor a bit, I decided to look a little more closely at the headline explanations for the market’s poor reaction.
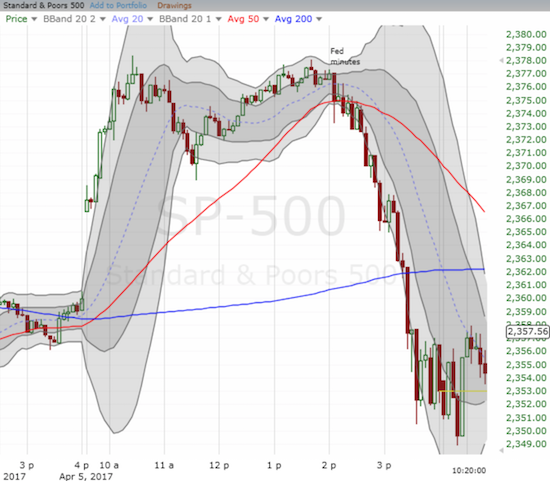
The release of the minutes from the Federal Reserve’s last meeting caused immediate and sustained angst
As a reminder, the Federal reserve hiked its interest rate at its last meeting. So I am little surprised that the chatter from Fed members shaded toward the hawkish side. I was a bit bemused to read headlines blaming the market’s angst on talk of shrinking the size of the Fed balance sheet and discussions about the high valuations in the stock market.
First of all, nothing the Fed said about shrinking the balance sheet was new. The Fed wants to be very careful in shrinking the size and it clearly stands ready to grow the balance sheet at a moment’s notice if the need arises. I compare and contrast quotes about the balance sheet between these minutes and the minutes for the January 31/February 1, 2017 meeting.
Jan/Feb meeting (emphasis mine)
“…it was noted that the downward pressure on longer-term interest rates exerted by the Federal Reserve’s asset holdings was expected to diminish in the years ahead in light of an anticipated gradual reduction in the size and duration of the Federal Reserve’s balance sheet.”
The Fed has spoken consistently about the need to shrink the size and duration of its balance sheet. The concept is not new and is certainly a key component of the Fed’s interest in normalizing monetary policy as much as is practical. I expect the Fed to re-examine its approach to the balance sheet at LEAST each time it hikes interest rates from here on out. (Note there seems to be no mention of the balance sheet at the December, 2016 meeting which also featured a rate hike).
I include my editorial in square brackets amid the quotes.
March 14-15, 2017
“Many participants emphasized that reducing the size of the balance sheet should be conducted in a passive and predictable manner. Some participants expressed the view that it might be appropriate for the Committee to restart reinvestments if the economy encountered significant adverse shocks that required a reduction in the target range for the federal funds rate.” [The Fed is clearly reticent about shrinking the balance sheet as it reassures itself and the market that it is willing and able to grow the size of the balance sheet in immediate response to any economic need.]
“When the time comes to implement a change to reinvestment policy, participants generally preferred to phase out or cease reinvestments of both Treasury securities and agency MBS. Policymakers also discussed the potential benefits and costs of approaches that would either phase out or cease all at once reinvestments of principal from these securities.” [The Fed has not made a decision on how to reduce the balance sheet. It is collectively and actively debating the pros and cons].
“…Nearly all participants agreed that the Committee’s intentions regarding reinvestment policy should be communicated to the public well in advance of an actual change. It was noted that the Committee would continue its deliberations on reinvestment policy during upcoming meetings and would release additional information as it becomes available. In that context, several participants indicated that, when the Committee announces its plans for a change to its reinvestment policy, it would be desirable to also provide more information to the public about the Committee’s expectations for the size and composition of the Federal Reserve’s assets and liabilities in the longer run.” [Relax, Mr. Market. The Fed fully intends to make this balance sheet exercise as painless and transparent as possible. We can of course debate how effective the Fed will be in this exercise.]
The Fed reserved its strongest language for its characterization of valuations in financial markets.
“Broad equity price indexes rose further, leaving some standard measures of valuations above historical norms…
Broad U.S. equity price indexes increased over the intermeeting period, and some measures of valuations, such as price-to-earnings ratios, rose further above historical norms. A standard measure of the equity risk premium edged lower, declining into the lower quartile of its historical distribution of the previous three decades. Stock prices rose across most industries, and equity prices for financial firms outperformed broader indexes…
Some participants viewed equity prices as quite high relative to standard valuation measures. It was observed that prices of other risk assets, such as emerging market stocks, high-yield corporate bonds, and commercial real estate, had also risen significantly in recent months. In contrast, prices of farmland reportedly had edged lower, in part because low commodity prices continued to weigh on farm income. Still, farmland valuations were said to remain quite high as gauged by standard benchmarks such as rent-to-price ratios.”
The Fed went a lot further than its observation in the December meeting. At that time, the Fed did not judge the market’s attempt to price in its optimism for the future: “Broad U.S. equity price indexes rose over the intermeeting period, apparently boosted by investors’ expectations of stronger earnings growth and improved risk sentiment, with much of the rally coming after the U.S. elections.”
This time, the Fed issued a relatively harsh judgement. Yet, we have seen this story before. The market can get twisted for a bit over the Fed’s disapproval, but it eventually shrugs its shoulder and scoffs at the Fed’s failure to understand how this time is different.
Through all the presumed angst over the Fed’s posturing and the other events of the week, the market stayed keenly focused on a June rate hike. Almost since the March rate hike, the 30-day Fed Fund Futures have priced in June as the likely timing for the next rate hike. The odds for a second rate hike coming in December have been even more stable (assuming the Fed hikes 25 basis points at a time).
To understand the context of the charts, recall March 15th was the announcement of the last rate hike, April 5th was the release of the minutes from that meeting, and April 7th was the combination of the lukewarm jobs report for March and the aftermath of the U.S. bombing of a Syrian airfield.
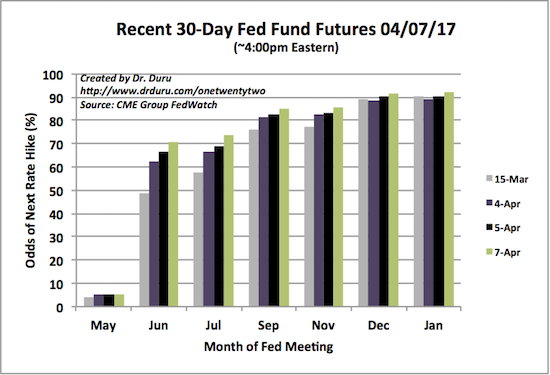
The odds for the next rate hike occurring in June have gone from 48.5% to 70.9%.
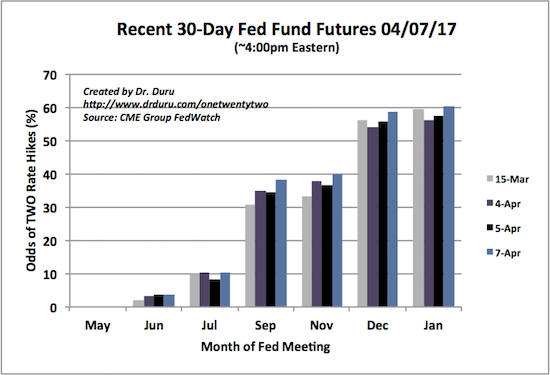
The odds for two rate hikes by December have gone from 56.2% to 58.8%.
I am most intrigued by the steady march upward of the odds for the next rate hike. June looks like a lock. At this point it will take some particularly bad news for the Fed to disappoint these rate expectations.
From my vantage point, the market’s many moving parts are getting noisier and no longer rubbing each other in a frictionless manner. The stock market is incrementally more dangerous. I have purposely used a relative measure to accommodate the starting point of any given market participant. I cannot imagine how anyone left last week without increasing their risk monitors at least a LITTLE bit!
Elsewhere in financial markets…
As the volatility index pressures upward, my key indicator of sentiment in the currency market flirted with very critical support. The Australian dollar (NYSE:FXA) versus the Japanese yen (JPY) traded exactly to 200DMA support on the heels of the Syrian bombing before rebounding going into U.S. trading on Friday.
Trading going into this week should be a very good tell. AUD/JPY is suffering from a definitive and heavy downtrend that makes 200DMA support appear likely to break. AUD/JPY has not traded below its 200DMA since the U.S. Presidential election. In a coming post, I am going to take a long overdue look at the Australian economy which now seems to be teetering a bit…
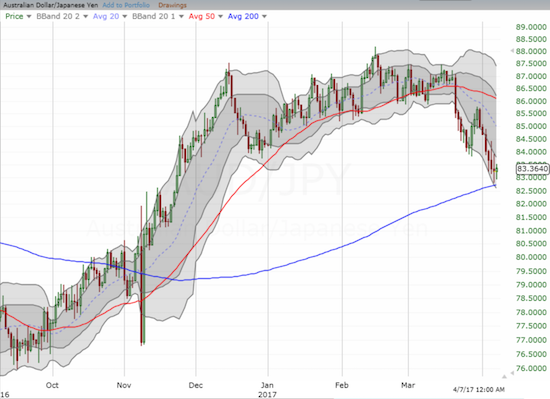
The Australian dollar hovered above critical support at its 200DMA uptrend against the Japanese yen.
Russian stocks suffered a blow on Friday. The VanEck Vectors Russia (NYSE:RSX) gapped down 3.2%. This latest close below its 50DMA is likely signaling a top for RSX.
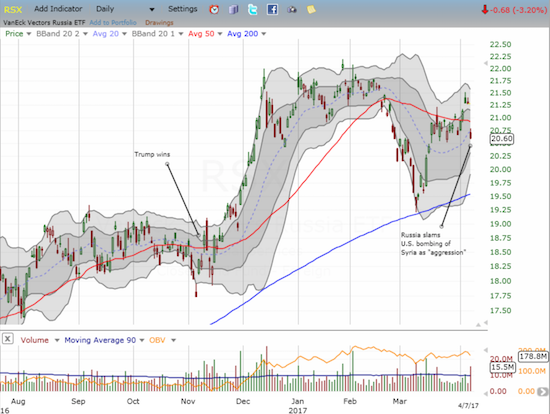
The honeymoon for VanEck Vectors Russia ETF (RSX) has likely come to an end as RSX gapped down below its 50DMA and failed at resistance from the Dec-Feb consolidation.
Speaking of Trump Trades, somehow I completely missed the comeback of the Mexican peso. The peso suffered mightily upon Trump’s election as the market bet on a weaker Mexican economy form the impact of a border wall and doom for the North American Free Trade Agreement (NAFTA). USD/MXN hit its peak right around Trump’s inauguration.
The currency pair has been all downhill ever since. Note that the U.S. dollar index currently trades right around where it did at Trump’s inauguration so the slide in USD/MXN almost all peso. (For properly interpreting what happened around the election for USD/MXN, note that the chart is measured on Eastern time with the day starting at midnight).
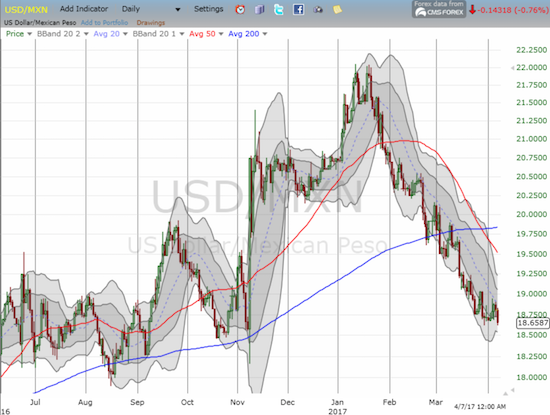
It’s as if Trump was never elected President: the Mexican peso sits comfortably where it was the day before the U.S. Presidential election.
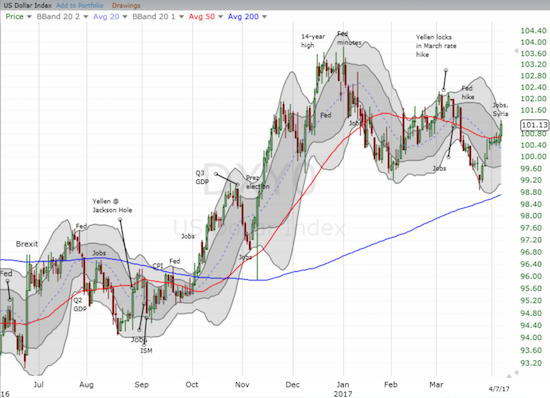
The U.S. dollar index confirmed the 200DMA uptrend by breaking out above its 50DMA again.
The Mexican peso joins a small, but growing list of trades which have completely reversed their impacts from the election. I have documented them as I come across them. One important player that has not quite reversed its post-election impact is the SPDR Gold Shares (NYSE:GLD).
Interestingly, the recent rebound in the U.S. dollar has not sent gold lower. However, GLD has now three times failed to conquer resistance at its 200DMA. A breakout should be VERY bullish for GLD and should finish the reversal of its post-election loss.
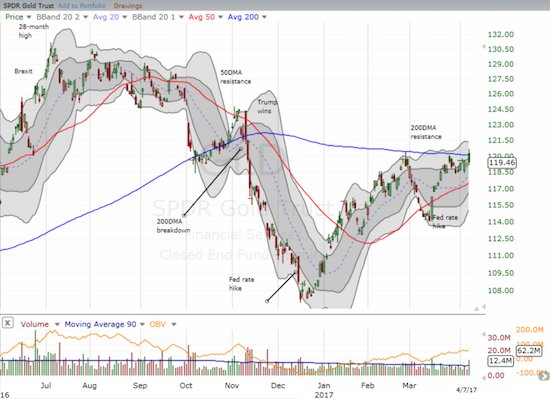
The SPDR Gold Shares (GLD) continues to struggle with 200DMA resistance. On Friday, GLD actually gapped ABOVE 200DMA resistance only to fade well below.
Turkey sits in the middle of what looks like ground zero for the next major conflict in the Middle East. I am surprised that the Turkish lira did not weaken significantly after the U.S. bombing of Syria. Could the lira be the next currency to rally against the odds with currency traders flocking for carry? How much worse can the news get for Turkey…?
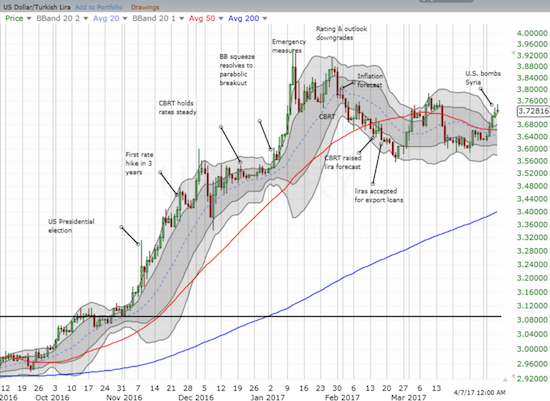
Is it time for the Turkish lira (USD/TRY) act contrary and rally in the face of an accumulation of bad news?
Bloomberg reports on the U.S. jobs report for March…
Above the 40” uses the percentage of stocks trading above their respective 40-day moving averages (DMAs) to assess the technical health of the stock market and to identify extremes in market sentiment that are likely to reverse. Abbreviated as AT40, Above the 40 is an alternative label for “T2108” which was created by Worden. Learn more about T2108 on my T2108 Resource Page. AT200, or T2107, measures the percentage of stocks trading above their respective 200DMAs.
Active AT40 (T2108) periods: Day #286 over 20%, Day #106 over 30%, Day #2 over 40% (overperiod), Day #15 under 50%, Day #27 under 60%, Day #58 under 70%
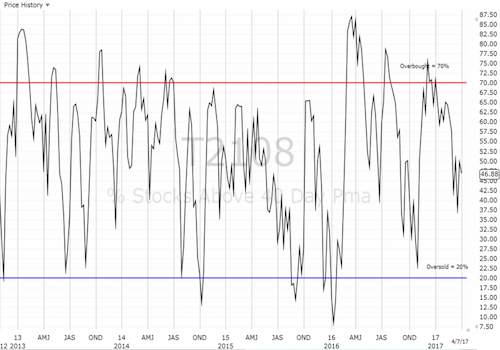
Daily AT40 (T2108)
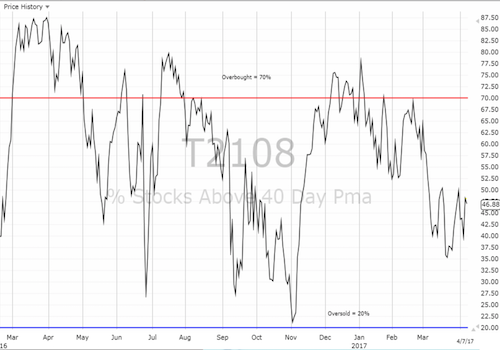
Black line: AT40 (T2108) (% measured on the right)
Red line: Overbought threshold (70%); Blue line: Oversold threshold (20%)
Weekly AT40 (T2108)
Be careful out there!
Full disclosure: long RUSS, long SSO shares and call options, long and short the U.S. dollar in various currency pairs, short EUR/TRY, long RUSS, long GLD shares and call options
