Advanced Micro Devices (NASDAQ:AMD) stock is up almost 34% since the start of 2019, beating the year-to-date return of the S&P 500 three times over. Shares fell to $16.04 on Dec. 26, when the bulls finally managed to fight back. Yesterday, the stock closed at $24.71, following an intraday high of $25.51.
Most people, anticipating the rally to continue, would often buy a stock after it has risen substantially. But as Warren Buffett once put it, “the investor of today does not profit from yesterday’s growth.” So let’s take a look at AMD through an Elliott Wave perspective and see if it is still a good stock to pick up for 2019.

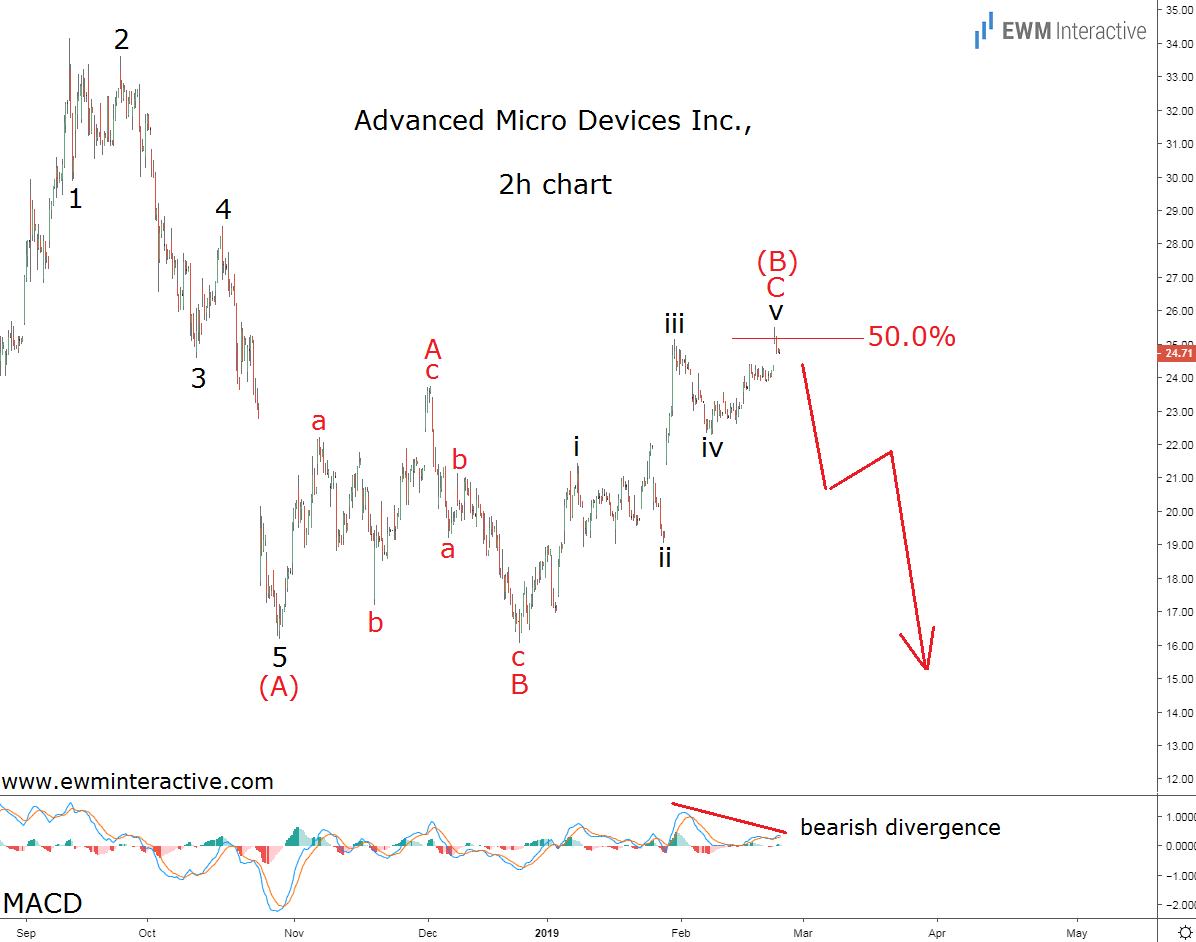
The 2-hour chart shows that the sharp selloff from $34.14 to $16.17 can actually be seen as a textbook five-wave impulse in wave (A), whose wave 5 is extended.
According to the Elliott Wave theory, a three-wave correction in the opposite direction follows every impulse pattern. And indeed, the rest of the chart reveals an A-B-C expanding flat correction in wave (B) up to $25.51 so far.
If this count is correct, there is a complete 5-3 cycle to the south from the September 2018 top at $34.14. Unfortunately for AMD shareholders, this means another decline to under $16 a share can be expected in wave (C) down from now on.
The MACD indicator further supports the negative outlook. It shows a bearish divergence between waves iii and v of C of (B), highlighting the bulls’ hidden vulnerability near the 50% Fibonacci level. In our opinion, this is definitely not the time to join the bulls in AMD stock.
