When Friday rolls around, we roll out the charts in the Wall Street Daily Nation.
After all, a picture is supposed to be worth a thousand words. So we figure, why not embrace it?
This week, we’re serving up some timely snapshots of the end of the (retail) world as we know it, S&P 500 volatility and the obscene cost to insure against the next market implosion.
There are a few nuggets in here for contrarians in the group, too. So take a look and be sure to let us know what you think!
Amazon Effect, Revisited
Amazon.com Inc. (NASDAQ:AMZN) is in the news again this week for scooping up an international purveyor of a smorgasbord of goods — Souq.com. The Dubai-based retailer claims that it’s the largest e-commerce site in the Arab world.
Clearly, Amazon’s Jeff Bezos will stop at nothing less than global domination.
You’ll recall that in February, I noted how quickly Amazon was gobbling up U.S. market share. It’s a zero-sum game, too.
When Amazon gains, others lose. Here’s the latest proof:

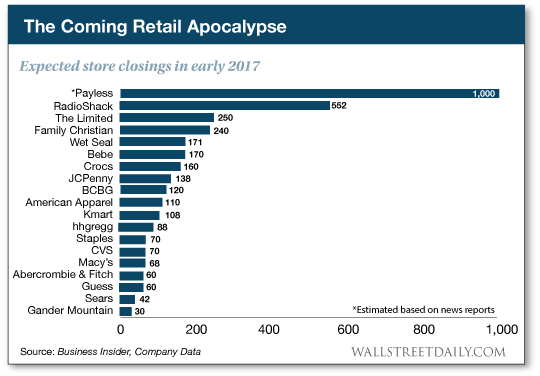
As Amazon continues to increase sales and expand operations, traditional retailers are shuttering stores. In fact, 3,507 stores are destined to close shop in the coming months, based on SEC filings.
News flash: If you’re looking for companies to sell short as they teeter on the brink of obsolescence, you couldn’t ask for a better list. We pegged RadioShack a long time ago. Others are destined to follow.
By extension, the country’s largest shopping mall REITs — like GGP Inc (NYSE:GGP) — make for compelling short candidates, too.
Streak Over… Now What?
Last week, I noted that it had been over 100 trading sessions since the S&P 500 index dropped 1% in a single day.
But I also mentioned that “it’s only a matter of time before volatility returns.”
Well, it did. On Tuesday, the S&P 500 fell 1.24%, ending the 109-day streak.
Now what?
Well, the number crunchers over at Credit Suisse are sounding the alarm bells, telling investors to prepare for a 10% correction in the near future.
The only problem? The numbers don’t add up.
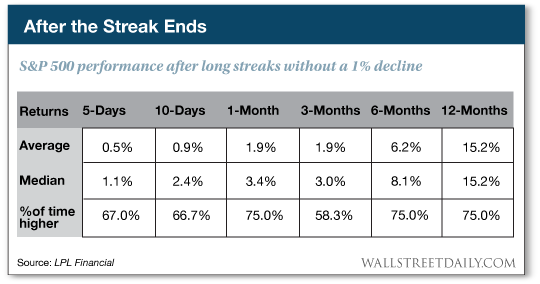
As LPL Financial reveals, following the 12 other streaks without a 1% decline for the S&P 500, the index rallied the majority of the time. No matter what time period you consider.

Incidentally, a similar analysis by Bespoke Investment Group confirms the same tendency for stocks to head higher.
Now, for those of you who prefer to hedge your bets — and protect against a sudden downturn — it’ll cost you!
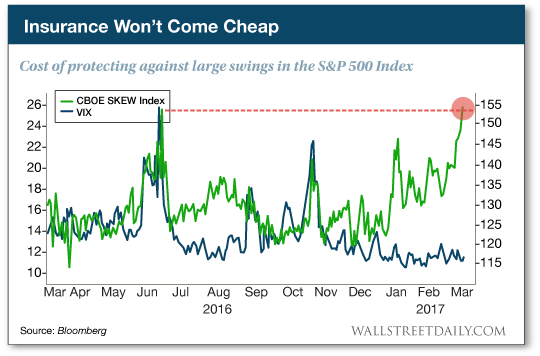
The CBOE SKEW Index, which essentially measures the cost to purchase out-of-the-money put options (bearish) on the S&P 500 — versus the cost to purchase out-of-the-money call options (bullish) — is soaring.

This index has often been referred to as the “black swan index.”
Sure enough, the last two spikes in the index were followed by declines. However, lightning-quick rebounds came almost immediately afterward.
Translation: Unless you’re really nimble, don’t attempt to time the market. It could cost you coming and going.
Instead, I’d recommend a more straightforward and simple risk-reduction technique: Use trailing stops to protect your profits and capital against any unexpected market volatility.
