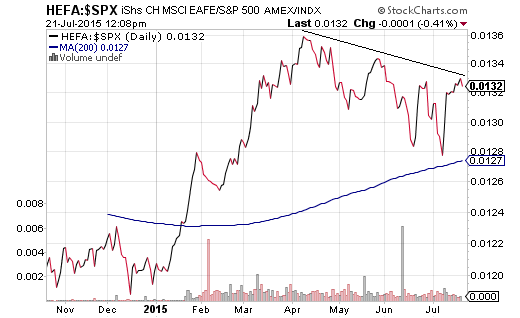
At the tail end of 2014, individual investors as well as financial web-site editors asked me for predictions on a variety of assets heading into 2015. I answered as many folks as I could. I suggested that foreign developed stocks via iShares Currency Hedged EAFE (HEFA) or Vanguard Europe Pacific (NYSE:VEA) would likely outperform U.S. stocks, due to perceived value, easing of monetary policy and four consecutive years of foreign-equity underperformance. (When was the last time that U.S. equities outperformed foreign equities for a fifth consecutive year? I am going to guess, “Never.”)
Indeed, funds like HEFA and VEA have outperformed the S&P 500 year-to-date. However, most of the gains came in the first quarter. Since the beginning of April, the relative strength on foreign stocks has been eroding on euro-zone uncertainty and economic deceleration in Asia.
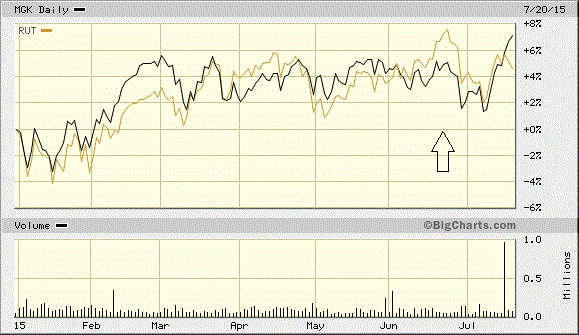
I also advocated on behalf of the largest of the large-cap companies over small-cap corporations. I anticipated that favorites like iShares S&P 100 (NYSE:OEF) and Vanguard Mega-Cap Growth (NYSE:MGK) would fare better than the Russell 2000 based on relative valuation, macro-economic weakness and latter-stage bull market allocation shifts. Historically, small caps tend to dominate early in bullish uptrends, yet fade toward the back end of a cycle.
Admittedly, small-caps had been surprisingly strong out of the 2015 gate. It wasn’t until the last 30 days – a period typified by the possibility of a Greek tragedy as well as U.S. economic downgrades – that smaller companies began to drift lower.
In truth, calendar-year predictions do no mean very much. I often explain to “do-it-yourselfers” that they should pay more attention to the management of downside risk than the pursuit of upside outperformance.
Minding the store for the possibility of loss becomes particularly important when bull markets become “long in the tooth.” The current run represents the third longest in history and the other two did not make it past eight years. That said, the problem is not participating in latter-stage bull markets with extreme overvaluation and/or exaggerated exuberance. The issue is whether or not a do-it-yourself individual understands how to take action to avoid the bulk of eventual adversity.
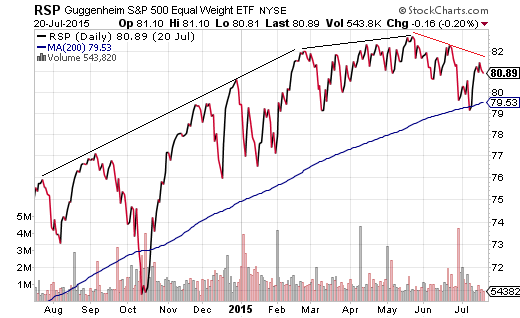
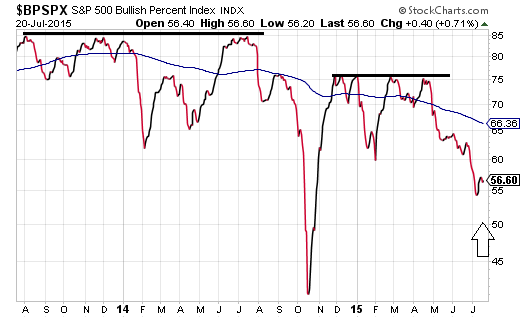
The first step is to monitor the internal health of key financial markets. For instance, as recently as yesterday (7/20/2015), the S&P 500 closed within a stone’s throw (0.12%) of a new all-time high. Yet, five of the 10 key economic sector investments (i.e., industrials, utilities, energy, materials and transports) have been languishing below respective 200-day trendlines; SPDR Select Energy (ARCA:XLE) just hit a new 52-week low. In the same vein, equal weighted ETF proxies like Rydex S&P 500 Equal Weight (NYSE:RSP) demonstrate internal weakness in many of the component corporations. What’s more, the Bullish Percentage Index (BPI) for the S&P 500 shows that participation has been diminishing markedly over time.
Again, the S&P 500 came within a few points of a brand new record on Monday (7/20/2015). Meanwhile, previous highs in 2014 came when RSP’s higher highs formed a steeper slope and bullish participation of index components tended to hit 85%. In 2015, RSP’s higher highs began leveling off and the bullish percentage on new S&P 500 records dipped to 75%. At the present moment, RSP appears to be charting lower lows, while the Bullish Percentage Index is down to 56%. All at a time when the S&P 500 is near all-time records?
Fewer and fewer big name companies are carrying popular benchmarks on their shoulders. Fewer and fewer stock sectors remain in definitive uptrends. In essence, the market internals are not particularly healthy for the longer-term sustainability of the bull.
History demonstrates that when market internals weaken, benchmarks eventually follow. Even more troubling is the reality that weak market internals coupled with tighter monetary policy as well as extraordinary overvaluation do not bode well for future price direction. It follows that the do-it-yourself investor should now concentrate on tactical asset allocation shifts that would enhance his/her probability of minimizing loss in either a sharp correction or an uglier bear.
My advice a few weeks ago still stands; that is, a larger allocation to cash is warranted when market breadth is deplorable. The average cash level/cash equivalent level across my client base of 225 families is 15%. Money market funds work fine. One might also consider SPDR Short Term Muni (NYSE:SHM) and/or iShares Short Maturity Bond (NYSE:NEAR).
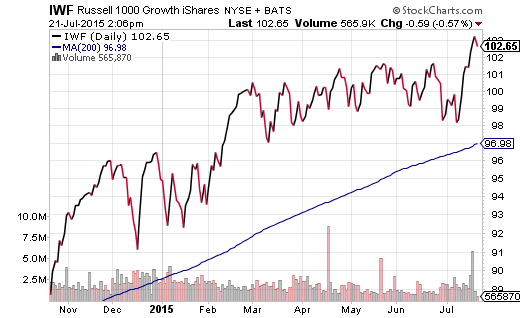
The do-it-yourself investor should also look at recent weakness in small-caps as an opportunity to shift to the largest of the large caps via iShares S&P 100 (NYSE:OEF). Large-cap growth via iShares Russell 1000 (NYSE:IWF) is also preferable to small-cap complacency, though one should employ stop-limit loss orders and/or reduce one’s allocation alongside a significant trendline breach.

