S&P 500: More To Go On The Downside?

Published 09/11/2020, 02:14 AM
Updated 11/16/2024, 07:53 AM
XAU/USD
-
US500
-
T
-
QQQ
-
AMZN
-
DX
-
GC
-
NFLX
-

Well, we opened higher, with the S&P 500 recouping its end of day losses from Wednesday. The problem, we failed at 3,425, the same spot we fell on Wednesday, and also the top of the gap fill. It led to a sharp decline in the markets through days end, finishing back at the bottom of the other gap around 3,330.

It leaves us an important point. If we manage to gap lower today, I think that things get ugly, moving to the downside, with the next stop around 3,260. It probably doesn’t end there, either.
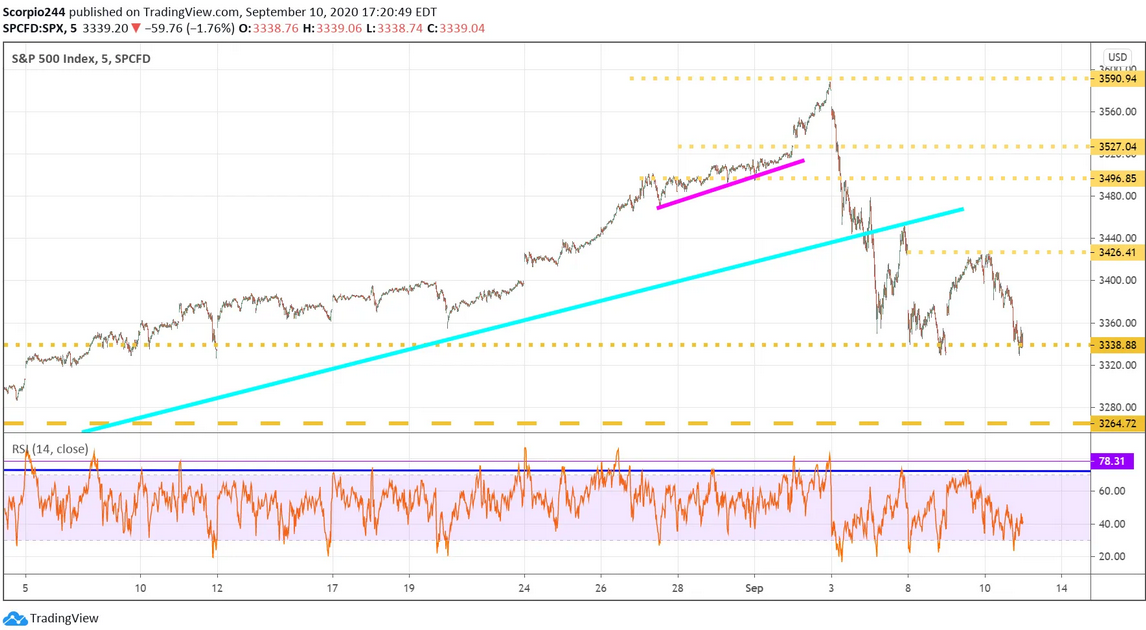
S&P 500 Index Chart

I tend to think there is still more to go on the downside here. The breaking of the uptrend is a major problem, and we haven’t even come close to retaking it. There is a clear trend lower in this market, and the buyers are being completely overwhelmed by the sellers at this point.

Nasdaq 100

Meanwhile, the Q's (NASDAQ:QQQ) to retake the uptrend and failed as well. The uptrends breaking in both indexes is not a good sign and suggests a longer-term break in trend and shift in direction. I think the next level on the Qs is somewhere around $265.

QQQ Chart

Dollar

The dollar fell hard initially following the ECB announcement, but recovered dramatically, rising back to 93.50. The dollar is getting ready to rip higher, you can see it in the chart. Once it breaks 93.50, it is off the races, I think, and that couldn’t be more bearish for gold.

USD Index Daily Chart

Gold

This trader standing there buying gold around $1925 is going get run over very soon. Gold is heading lower, I think. I wouldn’t be surprised to see back at $1790.

CFDs On Gold Daily Chart

Netflix

Netflix (NASDAQ:NFLX) is starting to break down, with the RSI now trending lower, and the stock sitting just over support at $475. Probably heading to $450, and lower. A break of $475 probably confirms a double top.

Netflix Inc Daily Chart

Amazon

Amazon (NASDAQ:AMZN) is in trouble too, breaking its uptrend the other day, and failing at the trend line again today. Momentum is leaving this stock in a hurry with a drop back to $2800 coming.

Amazon Inc Daily Chart

AT&T

AT&T (NYSE:T) is very close to a breakdown and drop to $27.35.

AT&T Daily Chart

Original Post

Latest comments

Loading next article…
Risk Disclosure: Trading in financial instruments and/or cryptocurrencies involves high risks including the risk of losing some, or all, of your investment amount, and may not be suitable for all investors. Prices of cryptocurrencies are extremely volatile and may be affected by external factors such as financial, regulatory or political events. Trading on margin increases the financial risks.
Before deciding to trade in financial instrument or cryptocurrencies you should be fully informed of the risks and costs associated with trading the financial markets, carefully consider your investment objectives, level of experience, and risk appetite, and seek professional advice where needed.
Fusion Media would like to remind you that the data contained in this website is not necessarily real-time nor accurate. The data and prices on the website are not necessarily provided by any market or exchange, but may be provided by market makers, and so prices may not be accurate and may differ from the actual price at any given market, meaning prices are indicative and not appropriate for trading purposes. Fusion Media and any provider of the data contained in this website will not accept liability for any loss or damage as a result of your trading, or your reliance on the information contained within this website.
It is prohibited to use, store, reproduce, display, modify, transmit or distribute the data contained in this website without the explicit prior written permission of Fusion Media and/or the data provider. All intellectual property rights are reserved by the providers and/or the exchange providing the data contained in this website.
Fusion Media may be compensated by the advertisers that appear on the website, based on your interaction with the advertisements or advertisers.
© 2007-2025 - Fusion Media Limited. All Rights Reserved.