
Electric utility stocks provide investors with stable earnings and performance along with consistent cash rewards.
Generally regulated and domestic focus electric utilities provide basic services and are independent of market volatility. Thereby, the companies enjoy consistent demand for their services.
Utility operations require constant investments for infrastructural upgrades and maintenance. Apart from internal sources, utilities depend on the credit market for funds to sustain these activities.
In this article, we run a comparative analysis of two electric power utilities — Ameren Corporation (NYSE:AEE) and CMS Energy Corporation (NYSE:CMS) — to ascertain the better stock.
Ameren, carrying a Zacks Rank #3 (Hold), has a market capitalization of around $18.05 billion. You can see the complete list of today’s Zacks #1 Rank (Strong Buy) stocks here.
CMS Energy, carrying a Zacks Rank #3, has a market capitalization of $15.76 billion.
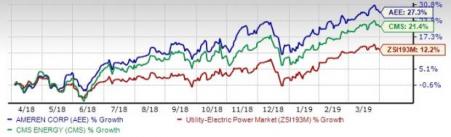
Price Movement
In the past 12 months, shares of Ameren have returned 27.3% compared with the industry’s rise of 12.2% and CMS Energy’s rally of 21.4%.
Long-Term Earnings Growth and Surprise Trend
Ameren’s long-term (3 to 5 years) earnings are expected to improve 6.79% compared with CMS Energy’s 6.37% for the same time frame.
Ameren pulled off an average positive earnings surprise of 8.59% in the last four quarters. CMS Energy delivered an average positive earnings surprise of 5.76% in the last four quarters.
Return on Equity (ROE)
ROE is a measure of a company’s efficiency in utilizing shareholders’ funds. ROE for the trailing 12-months for Ameren and CMS Energy is 10.87% and 13.93%, respectively. CMS Energy has an edge over Ameren.
Debt-to-Capital Ratio
The debt-to-capital ratio is a good indicator of a company’s financial position. The indicator shows how much debt is used to conduct the business. Ameren has a debt-to-capital ratio of 50.28% compared with the industry’s 50.42%. Meanwhile, CMS Energy has a debt-to-capital ratio of 69.04%.
Dividend Yield
Currently, dividend yield for Ameren is at 2.58%, lower than 2.75% for CMS Energy.
Estimate Revision
In the past 90 days, the Zacks Consensus Estimate for Ameren’s 2019 earnings inched up 0.3% to $3.30 per share and the same for CMS Energy’s 2019 earnings were unchanged at $2.51.
The Verdict
Our comparative analysis shows that Ameren holds an edge over CMS Energy in terms of price movement, long-term earnings growth and surprise trend, debt-to-capital ratio as well as estimate revision. Nevertheless, CMS Energy takes the cake in terms of ROE measure and dividend yield. It is clear that Ameren (AEE) is a better utility stock than CMS Energy (CMS).
Today's Best Stocks from Zacks
Would you like to see the updated picks from our best market-beating strategies? From 2017 through 2018, while the S&P 500 gained +15.8%, five of our screens returned +38.0%, +61.3%, +61.6%, +68.1%, and +98.3%.
This outperformance has not just been a recent phenomenon. From 2000 – 2018, while the S&P averaged +4.8% per year, our top strategies averaged up to +56.2% per year.
See their latest picks free >>
CMS Energy Corporation (CMS): Free Stock Analysis Report
Ameren Corporation (AEE): Free Stock Analysis Report
Original post
Zacks Investment Research