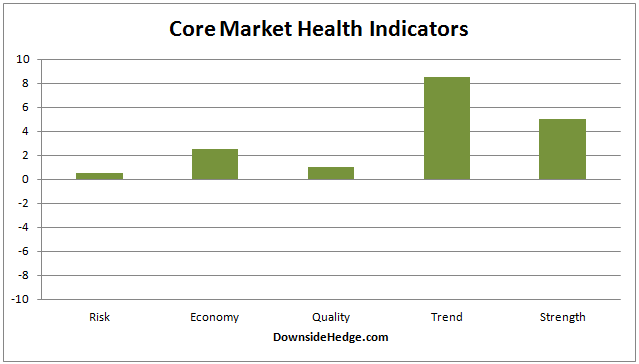
Over the past week, my core market health indicators continued to bounce around with some moving up and others falling. Most notably, my core measures of risk moved above zero. This changes the core portfolio allocations as follows:
Long / Short Hedged portfolio: 100% long high beta stocks
Long / Cash portfolio: 100% long
Volatility Hedged portfolio: 100% Long (since 11/11/2016)
Another thing of note this week, is that my measures of trend are now in overbought territory. This occurred as my measures of market quality fell. It’s not a situation I like to see happen. This adds some doubt to the current market, but some of the other measures I watch are simply showing normal bullish rotation. So the question is, bullish rotation or the start of a larger decline? We’ll have to wait and see.

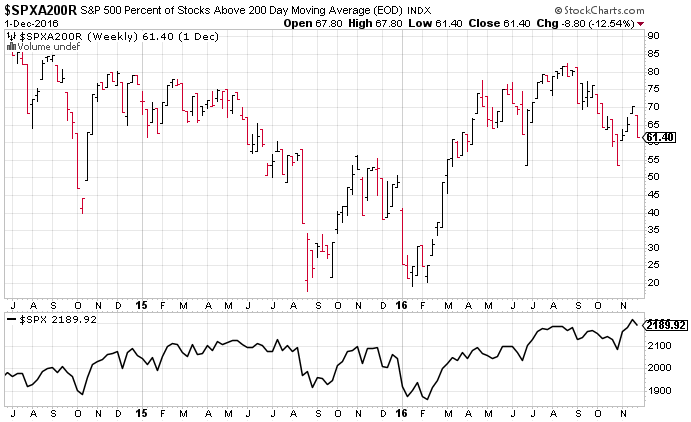
Another thing that is somewhat concerning, is that measures of breadth suffered more than expected this week. Take a look at the percent of stocks in the S&P 500 Index above their 200 day moving average. It suffered substantial damage this week with only a 1% drop in SPX. This shows how close so many stocks are to their 200 dma.

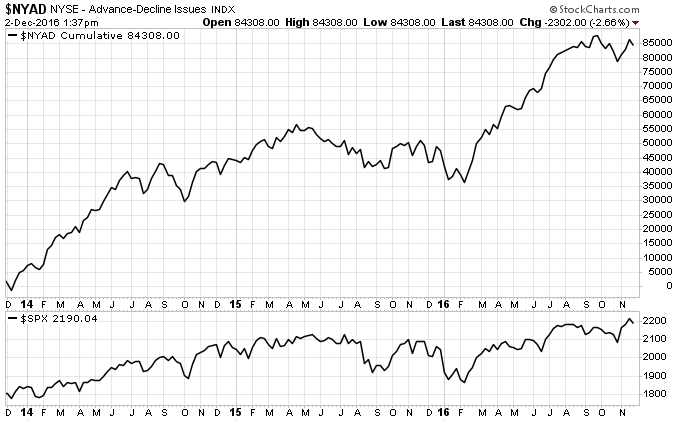
One theme I’ve seen this week is the divergence between the S&P 500 Index (SPX) and the NYSE Advance / Decline line (NYAD). Several financial commentators are noticing it. It’s something that I watch as a part of my overall breath indicators. So far, I’m not too concerned about it because the divergence is small and very short lived (often breadth follows a break to new highs).
For more information about the subject, I suggest you read Frank Roellinger’s NYAD divergence analysis at Six Figure Investing. The thing that stands out in his analysis is that short term divergences (less than 13 weeks) are often noise. This usually gives us a lot of time to adjust our portfolios before worrying about a severe decline.

Conclusion
My core measures of risk have gone positive, but measures of breath and market quality are deteriorating. Add to that, measures of trend are overbought. This has us adding portfolio allocation exposure without the underpinnings I’d like to see (but we do it anyway). I’ll be watching all of my breadth and quality indicators over the next few months very closely.