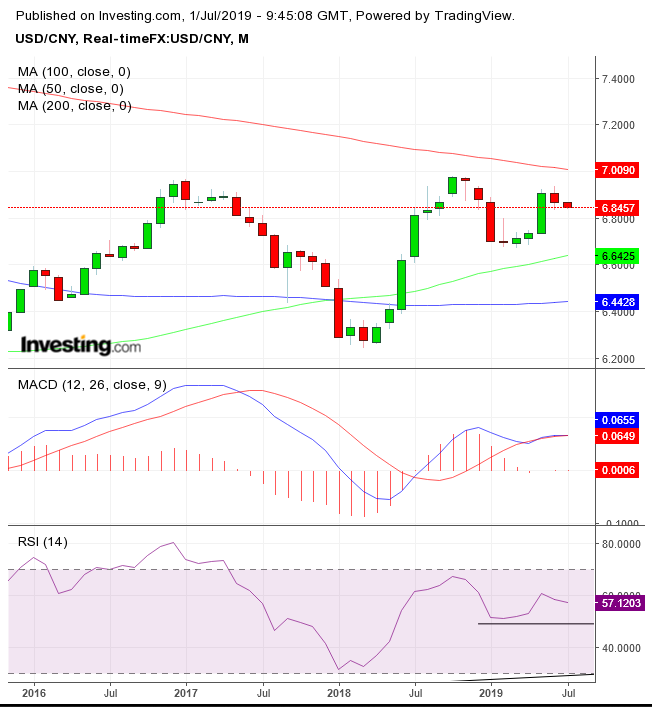
The yuan is enjoying a relief rally after the Trump-Xi meeting put further tariffs on hold, even if the path to a trade deal is no clearer than it was before. The USD/CNY fell 0.33%, but the renminbi is strengthening against a dollar that is on the rise against other currencies, making the Chinese currency’s rally even more impressive than it appears to be.
However, a dollar-yuan analysis is complex. Will this truce, followed by further talks, steer the Fed away from rate cuts? So far, nothing has changed fundamentally. No details have emerged to explain how the two countries will approach a deal that failed in previous attempts, though all the roadblocks are still in place.
Then there’s the Game-of-Thrones angle. U.S. President Donald Trump is making nice with his Chinese counterpart Xi Jinping, but is that because he intends to compromise on his core issues, or is it simply a ploy to buy more time till Trump shows Xi who is the alpha male of the pack?
The currency war is another issue. Not Trump’s accusations of China’s currency manipulations, though these are certainly a factor to consider, but the war around currency reserves. Currently, the U.S. dollar is the primary global reserve as well as the preeminent commodity denomination and currency of settlement. This gives Trump a very big stick—along with his loud tweets—with which to influence other countries to, say, join his coalition of sanctions against Iran.
China has been maneuvering to become a global currency, as part of the opening up of its financial markets, as well as setting up a yuan-denominated oil futures market, to compete with the U.S. The IMF said that the yuan’s share of global currency reserves increased in Q4 last year.
With so many different fundamentals to consider, each one complex, we refer to the charts to help us streamline a path for the forces of supply and demand.

While on the daily chart, the USD/CNY found support above the 200 DMA, on the monthly chart, the pair found resistance by the 200-month MA, which has been above prices since 2007.
The 200 MMA realigned with the most crucial supply-demand pressure-point, the resistance formed by the two previous peaks: October 2018 and January 2017. This makes the 7.00 such a powerful psychological level that the PBoC has been known to make it its red line.
However, last month, the South China Morning Post ran the article saying the 7 yuan-per-dollar level is “no longer ‘forbidden zone.’” Will the USD/CNY breach the 7.00 level for the first time since the 2008 crash? The odds are it will not.
Putting all the puzzle pieces together: the yuan has strengthened on renewed faith in China’s economy with the tariff-truce. Trump is already unhappy with the exchange rate, and if China doesn’t want all its U.S. exports to be hit with tariffs, exacerbating and accelerating its economic slowdown, it won’t violate that sacred ground, the 7.00 level.
The Fed’s path to a rate cut would add pressure to the dollar, strengthening the yuan. Additional global demand for the yuan will prop up a Chinese currency that is becoming more cosmopolitan.
Finally, the 200 MMA is the mother of all moving averages. Its realignment with the resistance level going back to 2016, below the 7.00 psychological level, means there are a lot of investors who are likely to stop buying at those levels and maybe even more traders who’d be happy to short the dollar against the yuan.
Note, the MACD is set for a bearish cross – when the short MA falls below the long MA – for the second time since the 2017 high, which would post a new low peak. And the RSI looks to do the same, which would bring the momentum indicator toward the macro uptrend line since the 2008 crash. Even if it doesn't breach it, it would still spell a significant downturn for the currency.
Trading Strategies
Conservative traders would wait for prices to fall below the 6.6 level, the 2019 low, guarded by the 200-week MA.
Moderate traders might short with a close below the 200 DMA at 6.8.
Aggressive traders could risk a short now, after prices fell to the lowest since May 10.
Trade Sample
- Entry: 6.8450
- Stop-Loss: 6.9000, June’s high
- Risk: 550 pips
- Target: 6.6800
- Reward: 1,650 pips
- Risk-Reward Ratio: 1:3
