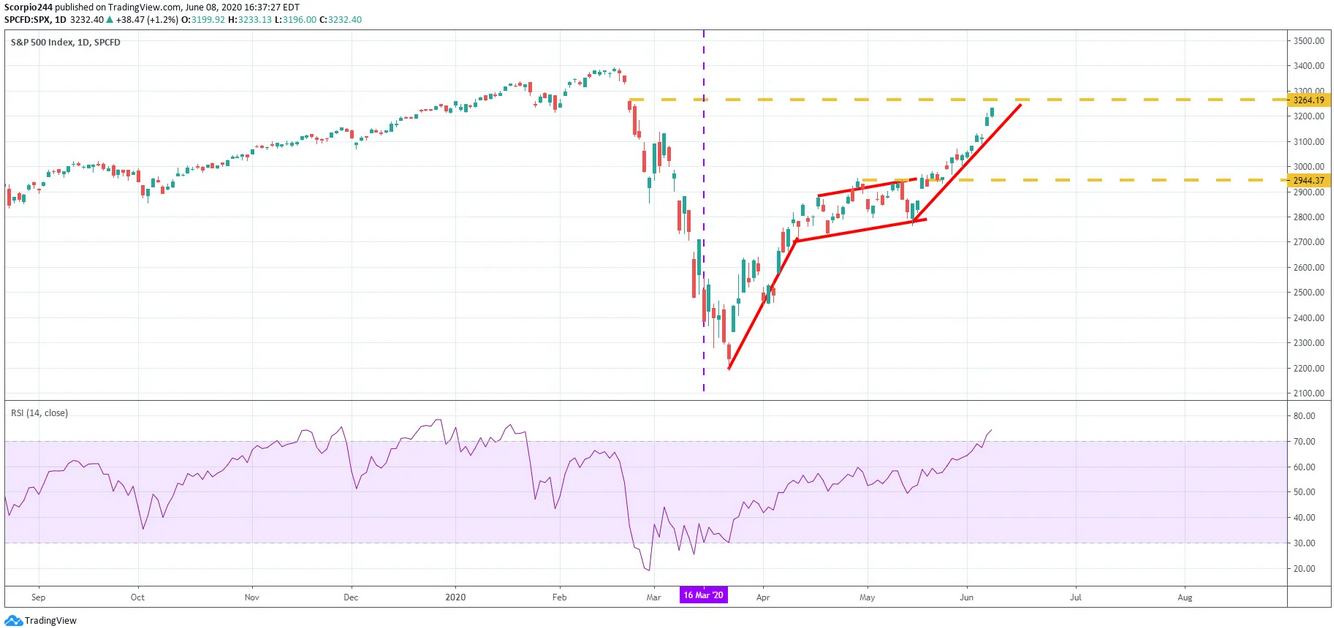
Stocks managed to start the week very strong, with the S&P 500 rising by another 1%. The index got a late day boost with nearly $3.4 billion to buy going into the closing print. The comeback for the market has been somewhat unusual, and surprising given the economic backdrop and lack of clarity around just how long it will take for the economy to recover.
While many people like to point out the market is forward-looking, which is, I can’t remember a time when so many companies have had such limited visibility into future quarters. Even Intel's (NASDAQ:INTC) CEO on TV yesterday morning noted that the second half of the year had limited visibility. It makes me wonder just how much the market can know at this point in terms of what the second half of 2020 will be like, results in July will surely be interesting.
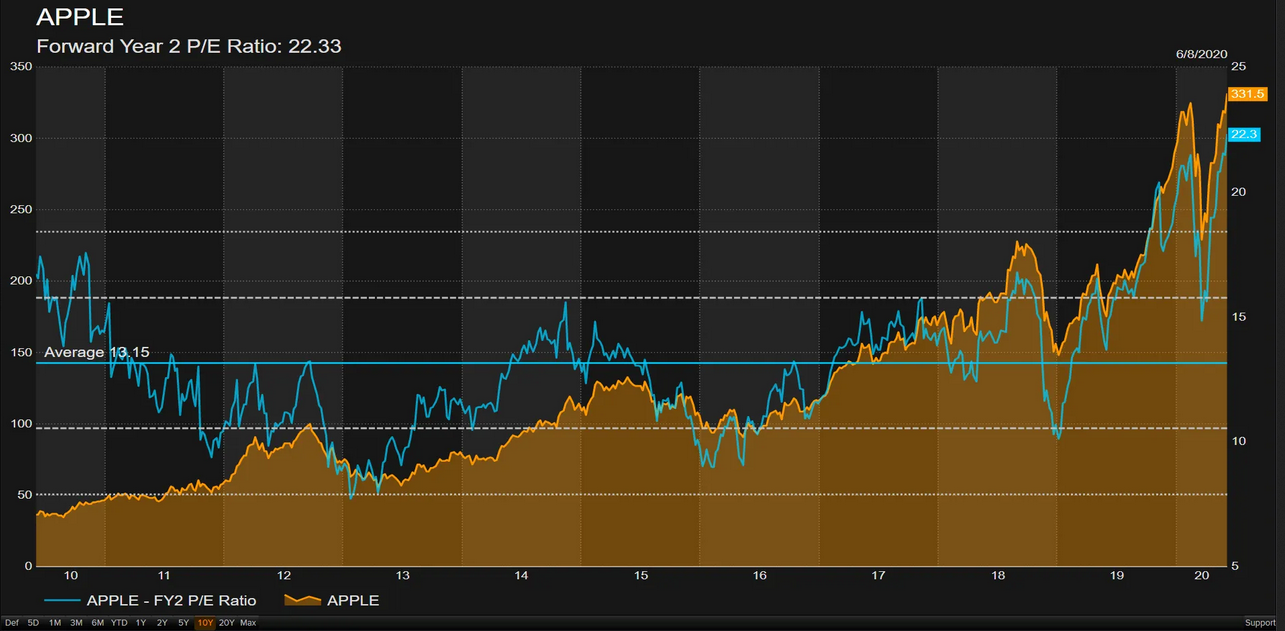
Take Apple (NASDAQ:AAPL), for example; the stock is trading at an all-time high, it is a stock I own. Yet, earnings expectations for next year have been falling, currently at $14.85 down from $15.62 in the middle of March. The stock’s gains have largely come at the hands of multiple expansion. Which is fine, but multiple expansion can only take everything so far.
Meanwhile, the S&P 500 reached 3230 and now finds itself with an RSI of almost 75. While I was more than happy to support the rally in the market since mid-May, with great caution, I am no longer supportive of this rally and feel it is ready to pop at a moment’s notice. There may be another 1% more to the upside, but at this point, this market is overbought by a wide margin, and Wednesday could mark a critical turning point from the Fed meeting.
The Fed will either have to go with the flawed jobs report and its misclassification and say the employment market is improving. Or it will have to defy the report, and tell investors the facts are the employment report was not positive at all, and the recovery is not as strong as it seems. This meeting creates several problems for the Fed; I do not envy Chairman Powell.
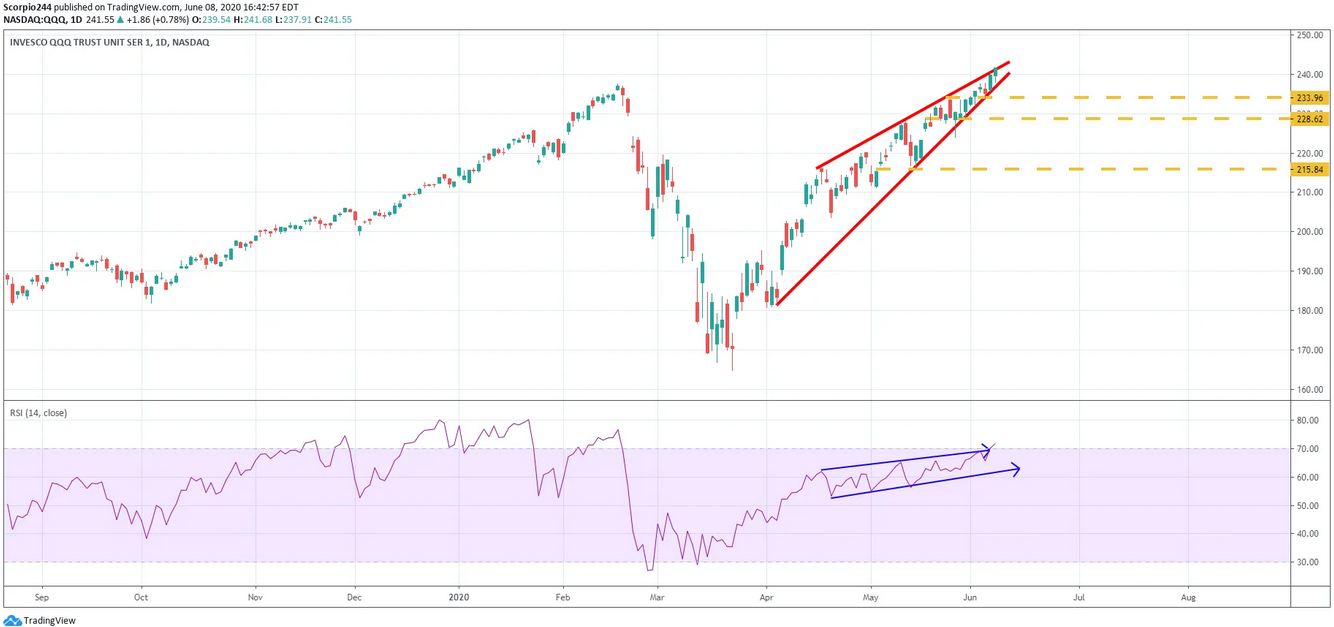
NASDAQ 100 (QQQ)
The QQQs are also overbought and are very close to completing the rising wedge pattern, I have identified. Again, it may only be a matter of time before the market turns sharply lower.
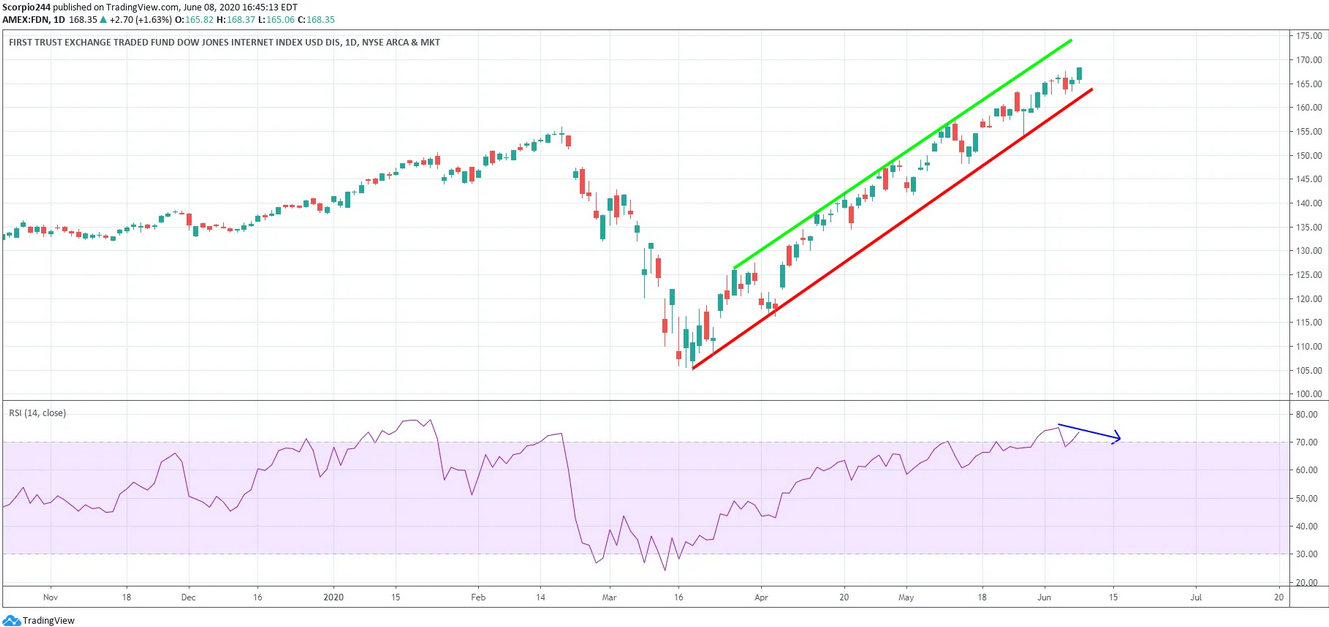
Internet ETF (FDN)
The First Trust Dow Jones Internet Index Fund (NYSE:FDN) Internet ETF now officially has bearish divergence.
Boeing
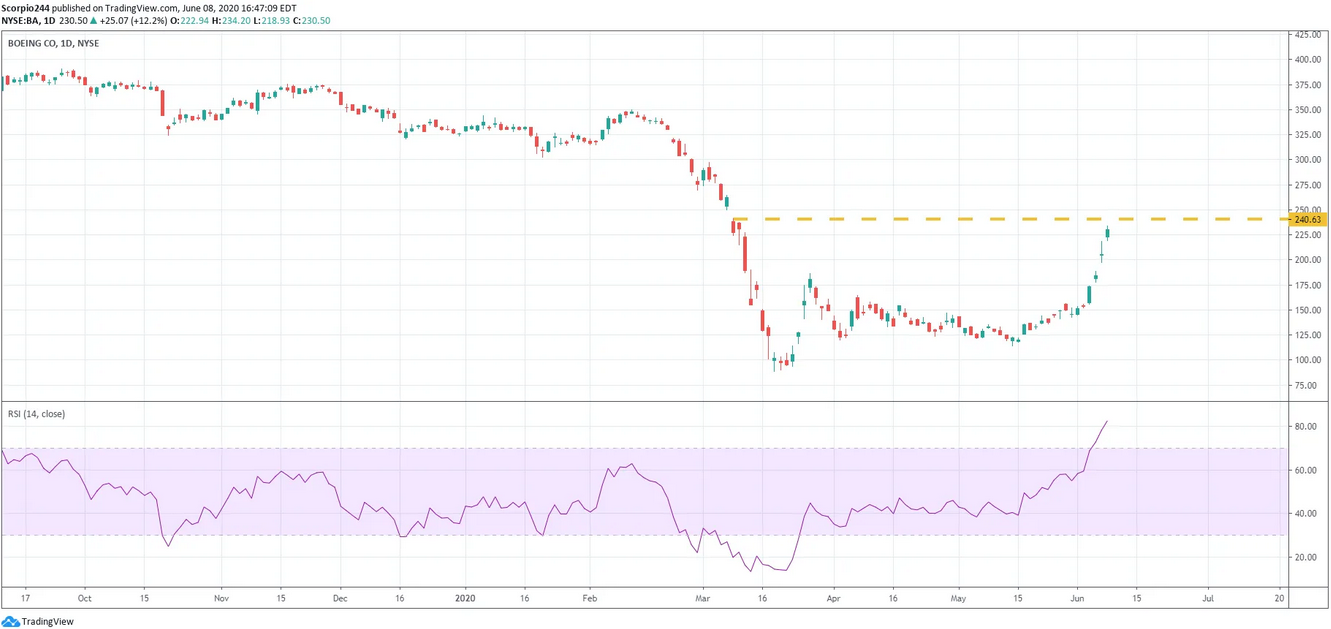
Meanwhile, Boeing (NYSE:BA) trades like some internet-based IPO in 1999.
NVIDIA
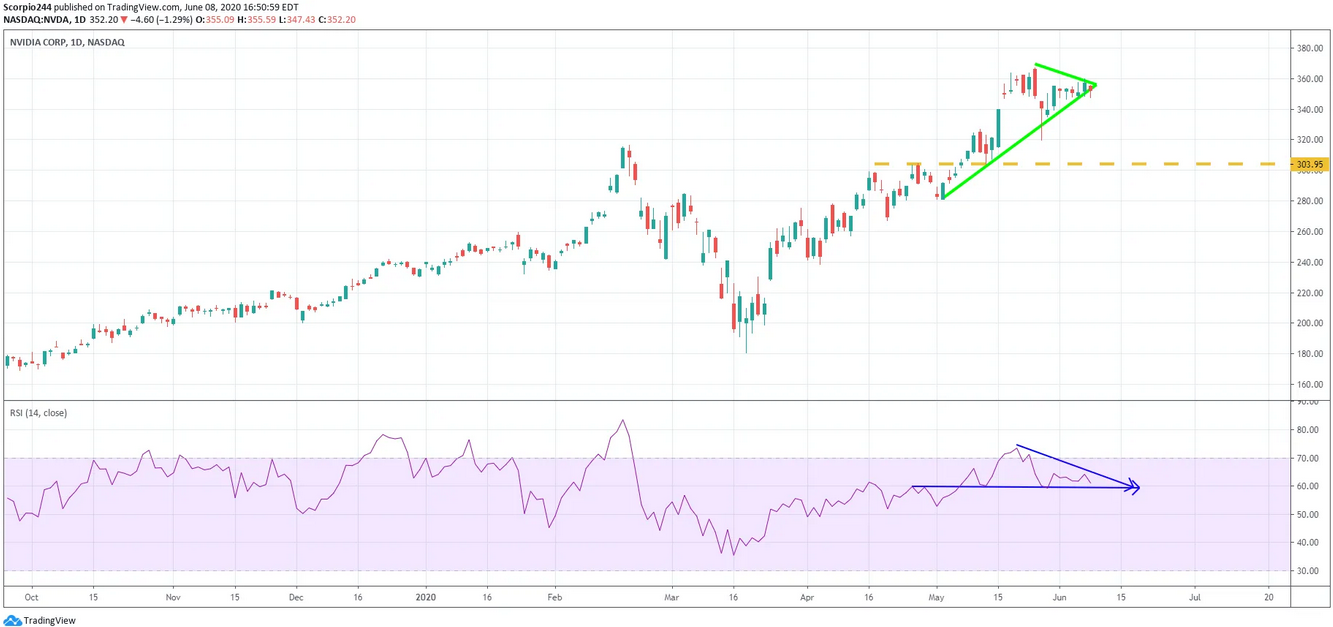
NVIDIA (NASDAQ:NVDA) is getting very close to breaking down and moving back to $300.
Shopify
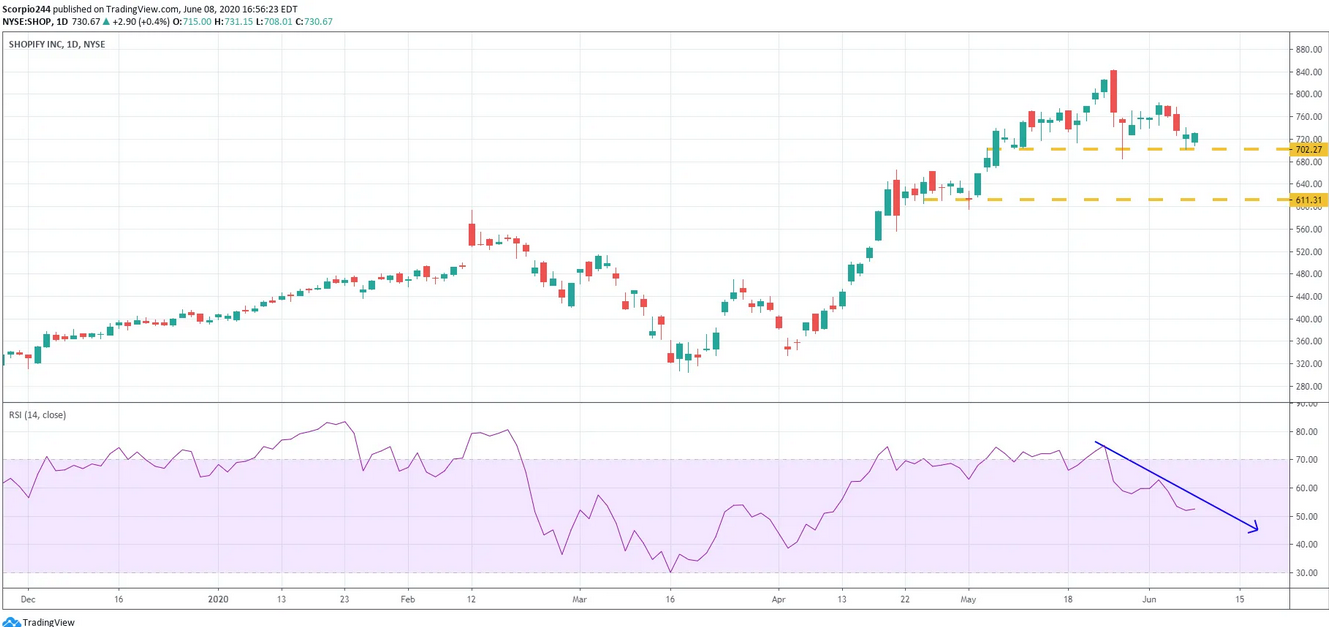
Shopify (NYSE:SHOP) is sitting on support at $702 and an RSI, which is trending lower. A break of support sends shares lower to $611.,
Home Depot
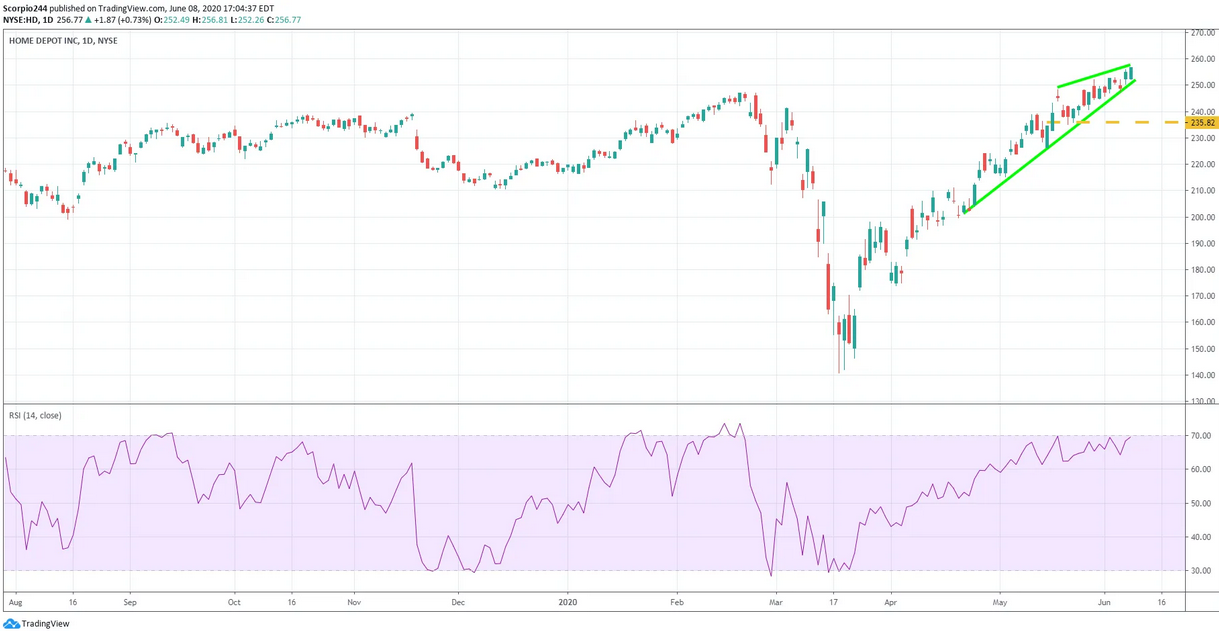
Home Depot (NYSE:HD) has a rising wedge pattern too, and it seems ready to pull back to $236.
