I could not be any prouder of my 20-year old daughter. In the recent semester, she received “straight 7s” while studying abroad at the University of Queensland in Australia. (Those are “As.”) More impressively, within a week of arriving back in the United States this past November, she secured two part-time lab assistant positions. That’s right. My kid works while pursuing her biology degree at the University of California in San Diego.
Why am I writing about my daughter’s triumphs? Beyond the fact that she is my favorite go-getter on the planet? In a nut shell, it occurred to me that she accounted for two – count them, two – of the 178,000 new jobs created in November.
No fooling. Each part-time post has been (or will be) counted as a new addition forged by a “robust” U.S. economy. What will largely be ignored? The disappearance of 446,000 jobs from the labor force last month alone.
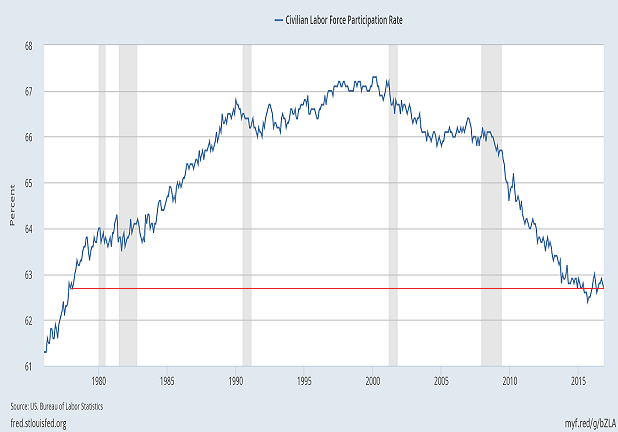
Sadly, the financial media highlight the headline U-2 unemployment rate (4.6%). It paints a rosy picture. What should they be talking about? They should focus on the 95.1 million working-aged individuals who are not employed (37.3%). If you want to understand why so many Americans believe that their children are going to experience a lower standard of living in the future than what they themselves have experienced, look no further than the labor force participation rate.
Granted, I am one of those “lucky one-percenters”. I will have enough for my retirement. And if my daughter could not get meaningful employment after she finishes her education, I’d have little difficulty paying her bills.
On the flip side, the exceptionally upbeat narrative on the state of the union is nonsensical. It is almost as misguided as those in the investment community who believe Trump is about to do for stocks what Reagan did in August of 1982. Specifically, there are those who are proposing that we are about to embark on a second leg up of a secular bull market stampede.
Well, then, let’s compare some of the particulars:
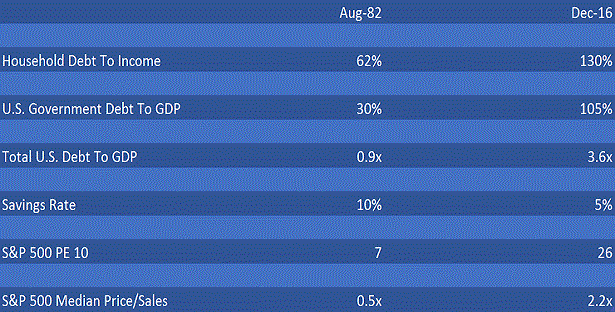
At the start of the 18-year secular bull (8/82) for U.S. equities, neither the U.S. government nor the American household were overwhelmed by debt. There was plenty of wiggle room for debt-financed government stimulus and debt-fueled household consumption. Today? With total debt exceeding economic growth (GDP)? The only trick in the playbook for a government to continue spending more than it takes in through tax revenue is ever-decreasing interest rates. Similarly, the only way that households can continue spending in excess of take-home pay is through ever-declining borrowing costs. Investors better hope that the recent jump in rates/borrowing costs is temporary.
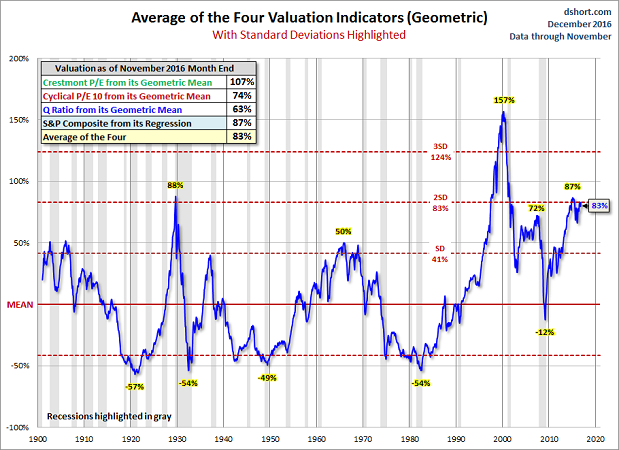
Another prominent feature at the start of the secular stock bull in 1982? Stocks were genuinely cheap. The cyclical PE 10 (CAPE) at 7 offered actual promise going forward. The price-to-sales (P/S) ratio of 0.5 practically screamed the word “bargain” after the 80-81 recession. Right now? The price-to-sales of 2.2 on the S&P 500 is only rivaled by dot-com mania in 1999. The PE10 is only rivaled by the dot-com bubble and the end of the Roaring 20s (1929); it is in line with the overvaluation that existed prior to the financial crisis.
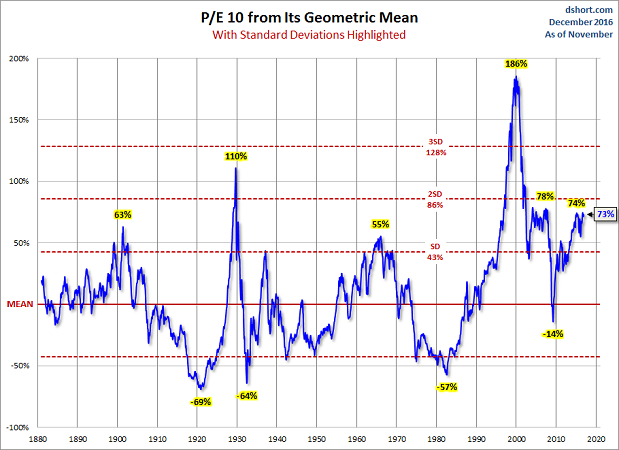
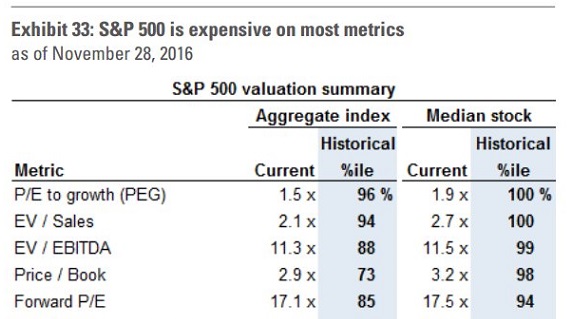
There’s more. We can identify stock overvaluation extremes in the Q Ratio and the current composite’s distance from its regression line. We can also expose stock overvaluation extremes in S&P 500 price-to-earnings growth (PEG), price-to-book, as well as forward price to operating earnings per share. No matter how you slice it? The stock market was a far better bargain in 1982 than it is here in December of 2016.
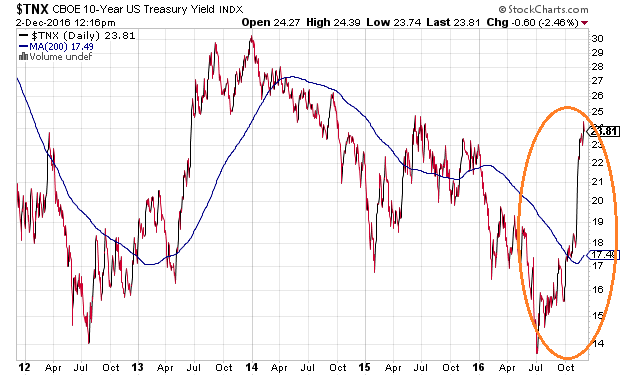
Not surprisingly, naysayers have consistently pointed to ultra-low interest rates as being the reason why stocks remain attractively priced and/or fairly valued. Unfortunately for the low rate crowd, the 10-year yield is now higher than the S&P 500’s dividend yield. Even more damaging to the “rates-are-super-low” justification? Historical precedent. U.S. stocks served up juicier dividend percentages than 10-year treasuries for roughly three decades between 1928 and 1958. A competing asset approach, then, would have failed the investor who piled on the equity exposure prior to stock bears in 1929-1932 (-86%), 1937-1938 (-49%), 1938-1939 (-23%), 1939-1942 (-40%), 1946-1947 (-23%) and 1956-1957 (-22%).
Perhaps ironically, even the narrative that stocks have been gaining ground like gangbusters is misleading. Did we witness a huge Trump bump for the Dow and for small-cap companies after the election? Absolutely. Are some stock investors giddy about the prospects for tax cuts, less regulation and infrastructure spending? Some are.
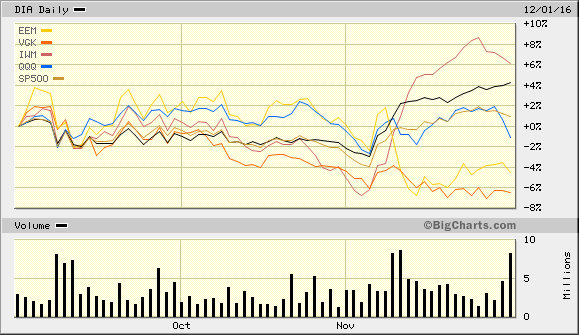
Nevertheless, the three-month returns across a wide range of stock ETFs show a far muddier picture for the diversified stock investor. As hot as the iShares Russell 2000 (NYSE:IWM) and the Dow Jones Industrials ETF (NYSE:DIA) have been, foreign equities via Vanguard Europe (NYSE:VGK) and iShares Emerging Markets (NYSE:EEM) have been ice cold. Even the S&P 500 SPDR Trust (NYSE:SPY) and the NASDAQ 100 (NASDAQ:QQQ) have traded flat (albeit near their highs) since the beginning of September.
In sum, the job picture is nowhere near as wonderful as it is commonly portrayed in the financial media. A dearth of high-paying career opportunities actually contributed to the surprise victory for Trump. Investors ought to bear in mind that the president-elect does not have the wiggle room that Reagan had in 1982, where rates could be manipulated lower and annual government deficits could be racked up to stimulate the economy. Equally worthy of note? Stocks were a bargain on nearly every measure in the early 80s whereas stocks are constrained by valuation extremes heading into 2017.
