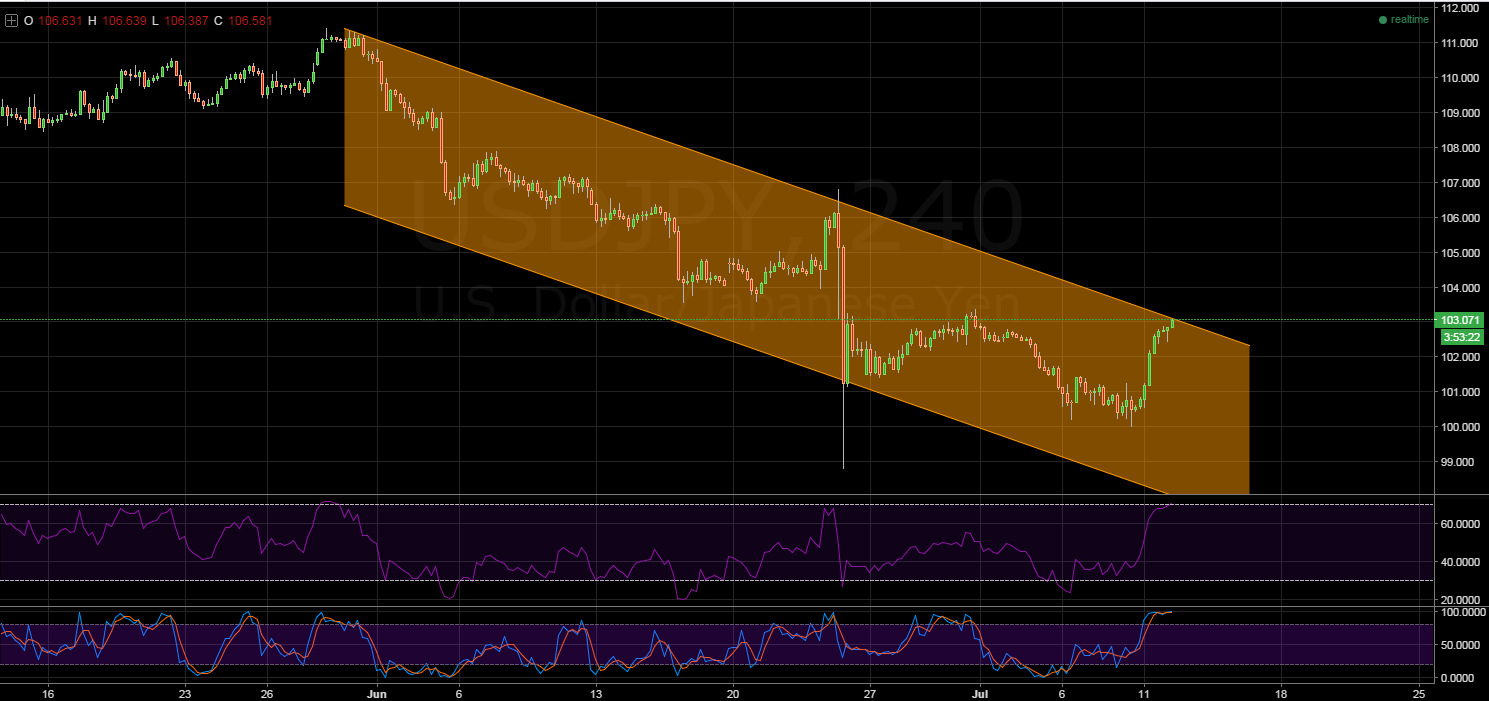
After a major surge in USD/JPY strength, the venerable pair now challenges the upside of a bearish channel which could mean a corrective slip is on the horizon. Moreover, a slew of other technical indicators are signalling that such a plunge is highly probable in the coming sessions. In the absence of another upset on the fundamental front, the USD/JPY could find itself testing the 100.00 handle once again, much to the chagrin of the Bank of Japan.
Firstly, as is evident on the H4 chart, the yen has been in decline for some time and has remained within a bearish channel. Over the past few hours however, a strong rally has seen the pair move to test the integrity of the structure which has got the bulls excited. Unfortunately, unless they can move the USD/JPY above the 104.00 handle, there could be another slip back to 100.00.

Breaking out on the upside is no easy task in this case, as shown above, both the H4 Stochastic and RSI oscillators are heavily overbought. Consequently, it will take another substantial push to see the channel broken convincingly.
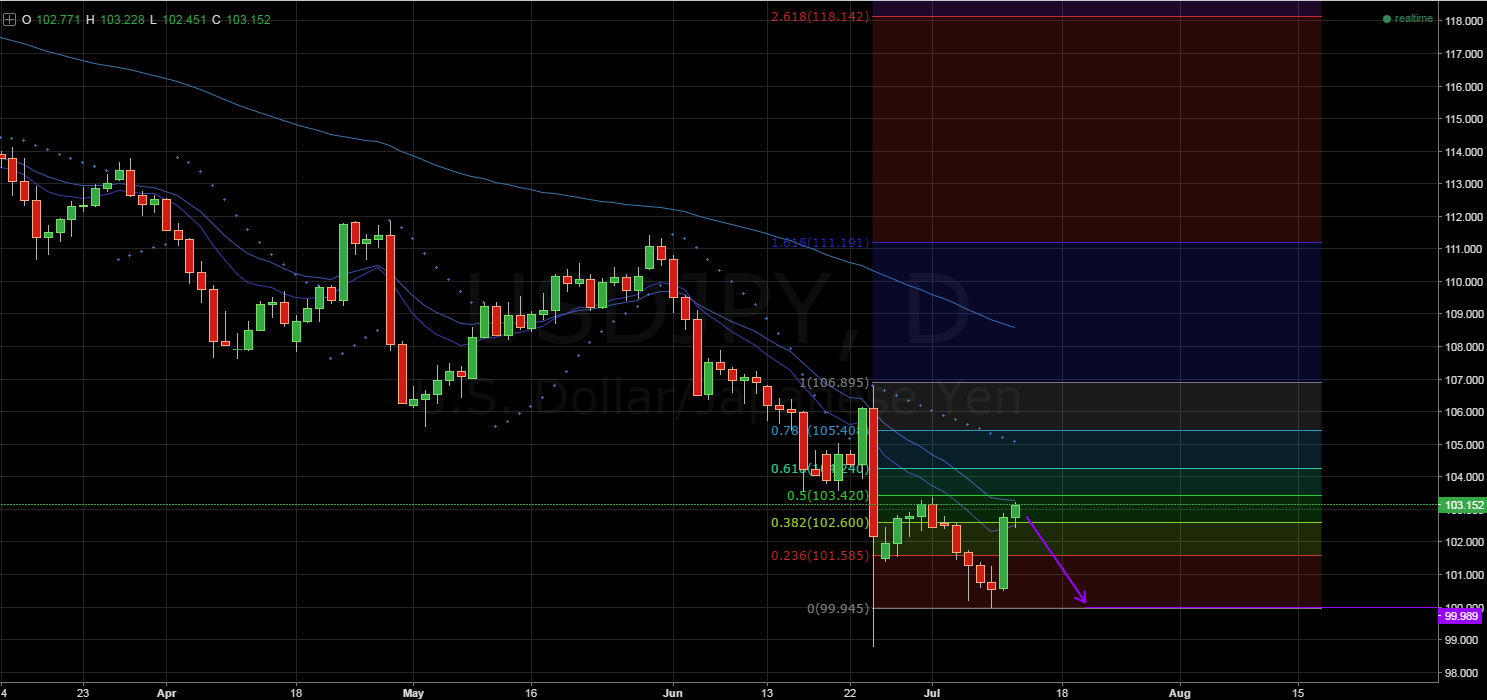
This being said, generating this level of momentum could be difficult given the incredibly persistent bearishness of the yen’s EMA activity which is clearly demonstrated on the daily chart below.

Also evident on the daily chart, the Parabolic SAR reading remains bearish which signals that the pair’s downtrend is still in full swing. As a result, whilst the USD/JPY could conceivably challenge the 50.0% Fibonacci level, the pair should collapse back to support around the 100.00 mark.
However, if the bulls do come out in force and push the Yen above the 61.8% Fibonacci retracement, this could represent a turning point for the pair and this could see a recovery take place.
On the fundamental front, Japan will be releasing the Japanese Tertiary Industry Activity results shortly which could send the USD/JPY plunging. Currently predicted to contract by 0.7% m/m, a surprise uptick in the figure could see a surge in sentiment for the JPY which could spark the pair’s tumble.
However, even without an uptick in the figure, a 2.58% increase in the VIX:IND could be signalling that uncertainty is beginning to creep back into the market. Consequently, there could be some increased positive sentiment for the yen as capital trickles back into the safe haven currency.
Ultimately, the sustainability of the USD/JPY’s most recent rally is somewhat suspect given the pair’s recent activity. Being not only highly overbought but also nearing the upside constraint of its bearish channel, a tumble back to support is looking highly likely.
However, the pair is unlikely to travel far below the 100.00 mark due to market intervention on the part of the Bank of Japan. This being said, keep an eye on the 61.8% Fibonacci level as, if broken, it could signal a change in trend direction for the USD/JPY.
