In this article I wrote about a “slow and steady” approach to investing that included usage of the S&P 500 Low Volatility Index. Reader DB inquired about what the results would look like if we used the S&P 500 index itself rather than the Low Volatility index.
The Results
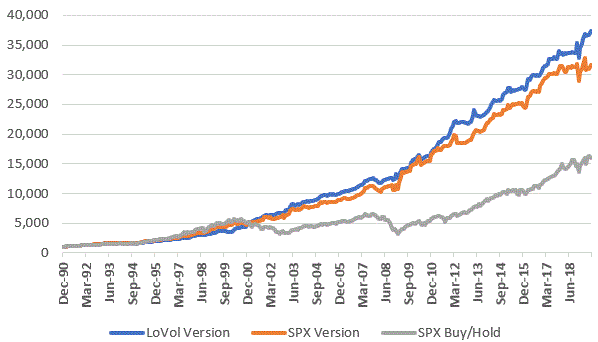
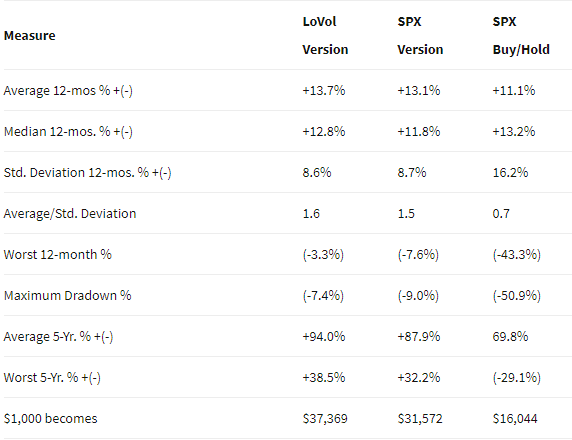
During the test period of 12/31/1990 through 8/31/2019, the Low Volatility version, performed better than a version that uses the S&P 500 index. For the record, both versions handily outperformed buy-and-hold.
Figure 1 displays the cumulative growth of $1,000 in:
*Blue line: S&P 500 Low Volatility (held Mar,Apr,May,Nov,Dec) version
*Orange line: S&P 500 Index (held Mar,Apr,May,Nov,Dec) version
*Grey line: S&P 500 Index Buy-and-Hold

Figure 2 displays the comparative facts and figures

With the eternal (and technically very appropriate) caveat that “past performance does not guarantee future results,” using the S&P 500 Low Volatility Index in my Slow and Steady system appears to add value beyond the Slow and Steady version that uses the S&P 500 Index, and particularly against a buy-and-hold approach.
As always, this is not a “recommendation” – simply a report of hypothetical back-tested results.
