Cliff Asness, co-founder of AQR Capital Management, has a request: “Please Stop Talking About the VIX So Much.” The popular risk metric, which tracks the implied volatility of the S&P 500, has been unusually low, at least its latest pop. Obsessing over the VIX, however, is getting under his skin.
“When people talk about the VIX they are almost entirely talking about recent realized volatility,” he wrote last month.
But somehow, because the VIX is a current forward looking measure (really a type of price) people seem to attach more to it than that. To simply just say, “things have not been bouncing around a lot lately” doesn’t quite sound like a damning indictment of current complacency as much as just a fact. Yet the VIX and realized volatility are almost entirely the same thing.
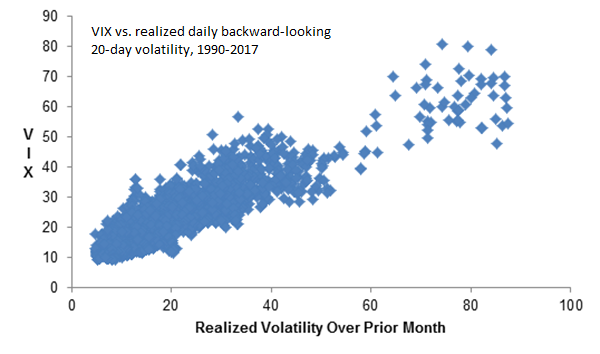
Asness crunches the numbers and reports that the VIX and the rolling 20-day volatility (standard deviation) of the S&P 500’s daily percentage changes are closely correlated, posting a 78% R-squared. It’s also clear from visual inspection that the two data sets share a high degree of commonality, as he demonstrates via the graph below.

If the two metrics are equivalent, there’s no advantage to modeling risk with the VIX compared with backward-looking volatility, which has become a popular tool in portfolio applications in recent years, including tactical asset allocation. Indeed, a number of studies (see here, for instance) recommend using some aspect of vol for risk management.
If there’s no edge to the VIX vs. plain-vanilla standard deviation, we should expect to see the evidence by studying recent surges in stock market volatility. In particular, if the two risk measures are more or less the same, there isn’t likely to be an earlier warning signal via the VIX.
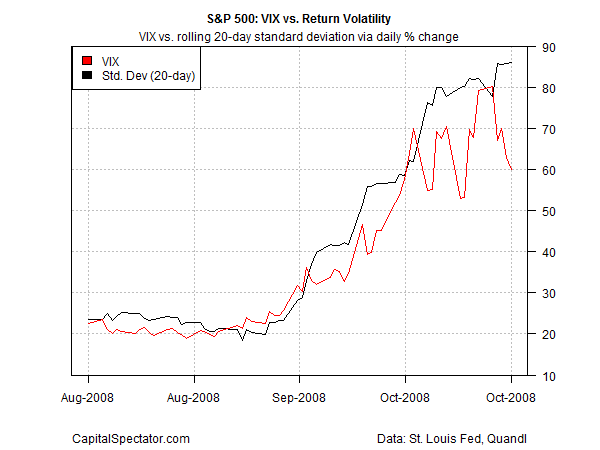
As a preliminary review, let’s look at three events in recent years, starting with the stock market crash in September 2008 that was linked with collapse of Lehman Brothers. As the chart below shows, the two risk measures moved largely in sync. Both jumped sharply on Sep. 15, 2008, when Lehman filed for bankruptcy, which triggered a dramatic selloff in stocks that rolled on for months. But to the extent that you were looking for insight via the VIX and standard deviation, it’s not obvious that one was superior over the other

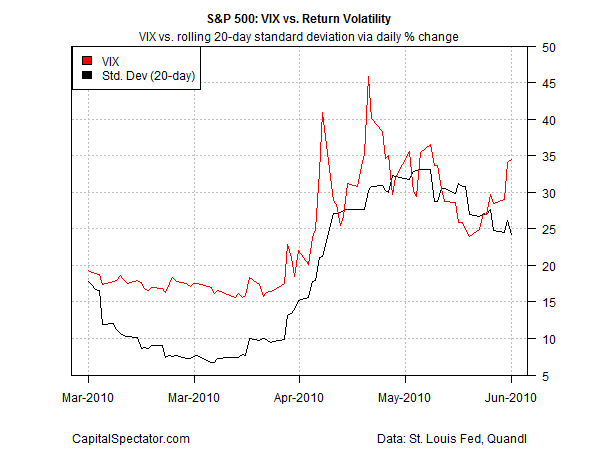
In the correction during the spring of 2010 one can argue that the VIX spiked a bit earlier than 20-day volatility. But it’s debatable how valuable this would have been in real time, particularly if you weren’t a short-term trader.

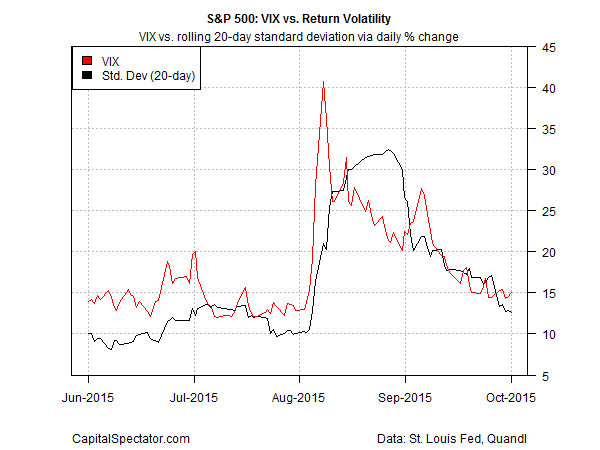
In the August 2015 selloff, the VIX shot up faster than vol, but to the extent there was an edge it lasted only a day or so relative to rolling standard deviation.

The charts above are hardly the last word on the subject, although they do suggest that there’s no short cut for risk modeling by favoring the VIX over conventional measures of volatility. Nonetheless, a deeper level of testing is recommended before drawing any final conclusions. One path of study is to compare how different rolling periods for standard deviation compare, and across a broader set of time periods. Keep in mind, too, that there are other methods for modeling risk that are worth studying – GARCH-based volatility, for example.
Nonetheless, history tells us that it’s prudent to look at a mix of risk metrics. VIX deserves to be on the short list, but it’s hardly a silver bullet.
