It is important to have an ongoing and adjustable plan that makes sense at all times with the macro markets around it.
So that said, let’s take a snapshot of where things stand currently with the understanding that this work will need future updates. It is up to the reader to do the work required to put context to the picture.
First off, Commitments of Traders data are only available through 12.31.18 as a result of the government shutdown. So we are flying somewhat blind from that perspective. At the end of December, the COT for gold and silver were well on their way to a bearish alignment. Have they maxed their trends and reversed in the meantime? It is quite possible, especially since the metals have taken pullbacks (within their intermediate uptrends) recently.
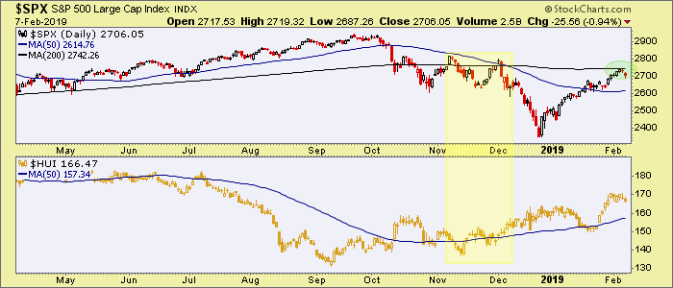
We have been following an analog to 2001, which saw SPX break down below its 50 and 200 day moving averages as HUI began its bull market. What’s more, SPX then tested its breakdown in Q1 2001…
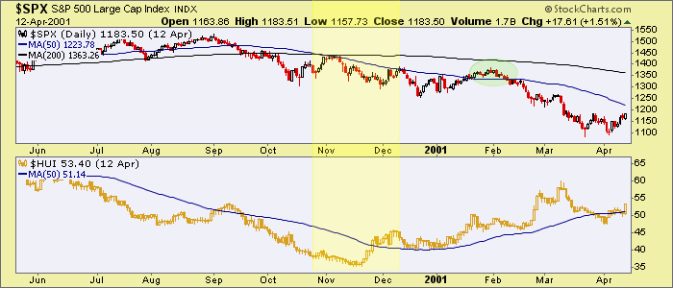
…just as it is testing its breakdown in Q1 2019 (ref. the green ovals). As of now, the analog is still very viable.
We have for some time now been noting the undervaluation in the miners/royalty stocks that make up the HUI index. As gold has climbed higher over the years vs. the broad commodity complex (including key mining cost drivers like energy) the gold sector has shed its former gross overvaluations of the previous bull market in favor of the gross undervaluation that a bear market brings.
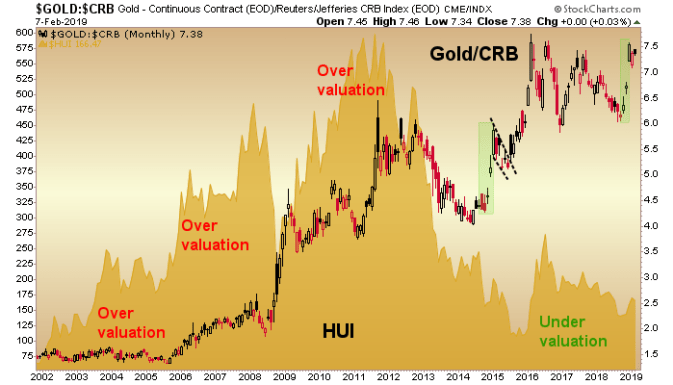
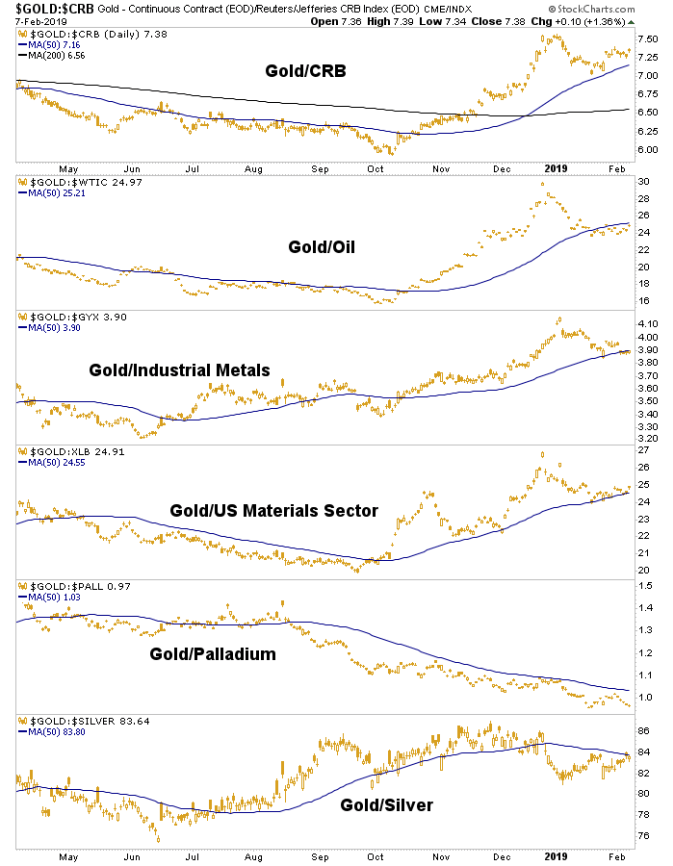
The above is a big picture monthly chart of Au/CRB. Let’s dial in a daily chart. Au/CRB is holding its intermediate uptrend (at the SMA 50) thus far. Au/WTIC, Au/GYX, and Au/Materials should also hold for a constructive view. Au/Pd is its own animal because Palladium’s supply/demand fundamentals are at this time, their own animals. Au/Ag is still constructive for precious metals because gold is contained vs. silver.
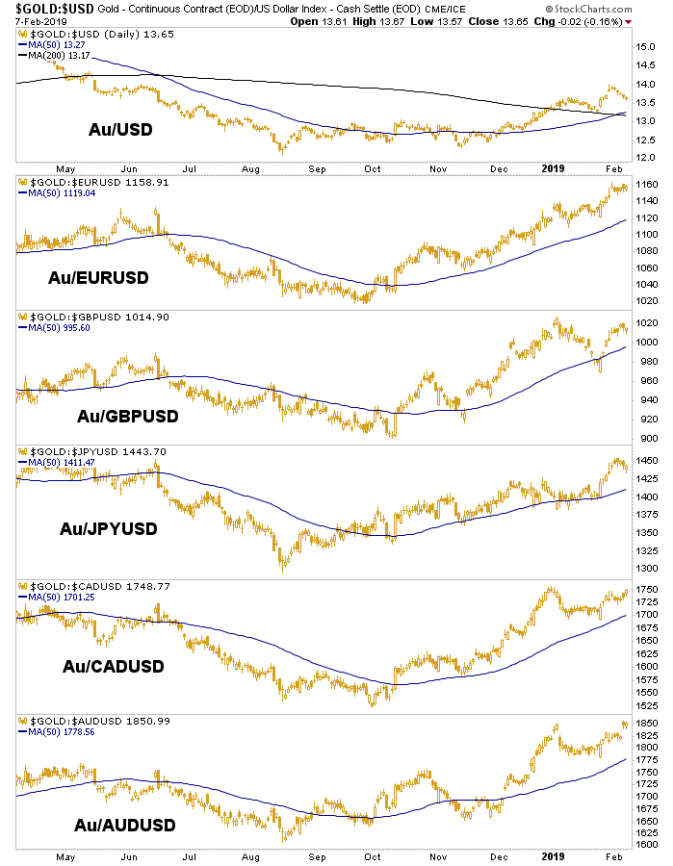
Gold continues to function quite well vs. global currencies. If you subscribe to the idea that a real bull market in gold sees it rising in all currencies then you like this daily chart. The intermediate trends are up vs. the U.S. Dollar Index and its global pairs.
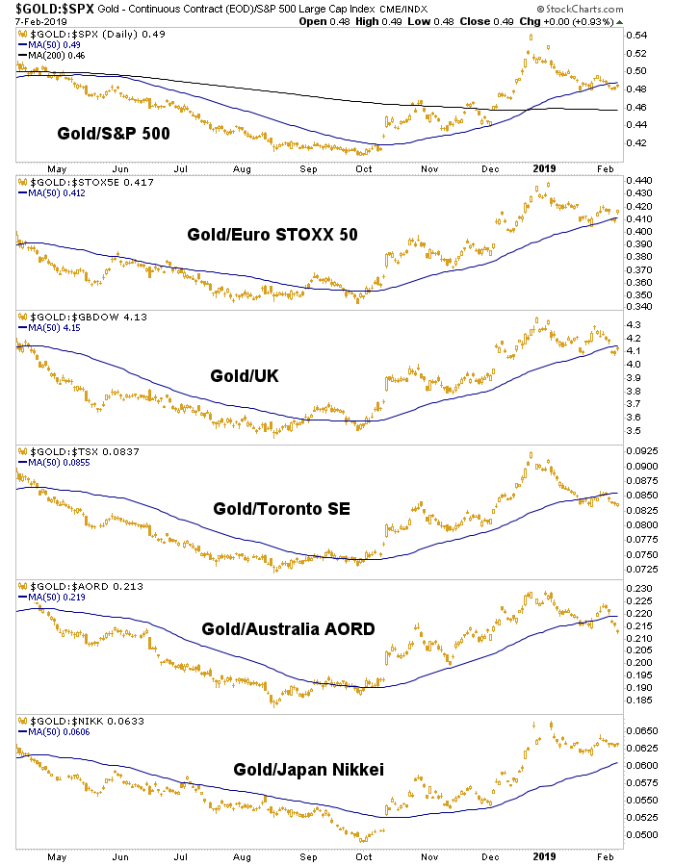
This is one I often make a big deal about. Gold vs. developed economy stock markets must rise for a positive macro fundamental backdrop to be in place for the precious metals sector. The big spike upward in Q4 2018 became overbought and was unsustainable. Enter the stock market relief rally that we anticipated into the Christmas Eve massacre. It has been a humdinger but it has not broken gold down from its relative intermediate uptrends vs. these markets. What’s more, nominal SPX has hit another of our upside bounce targets amid once again overbullish sentiment and is thus a candidate to reverse (was yesterday a start?). Gold is generally fine here but needs to turn up again soon.
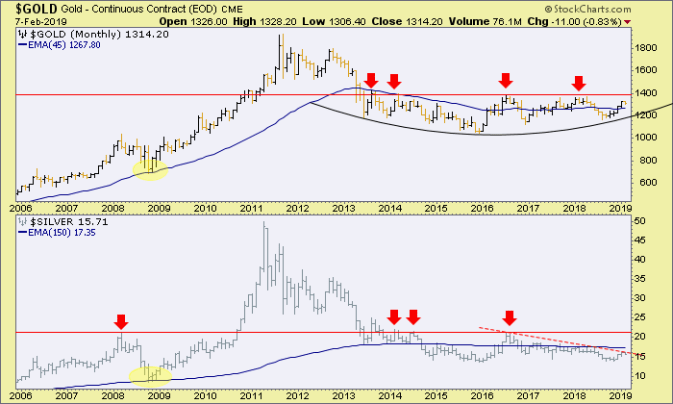
The monthly charts of gold and silver tell their stories. 1378 is the gateway to a new bull market in gold. Silver has a long way to go but has risen to a (red dashed) downtrend line that could get the bugs excited if it were to break. Silver does not confirm a bull market unless it breaks above 21.23, which was 2016 high.
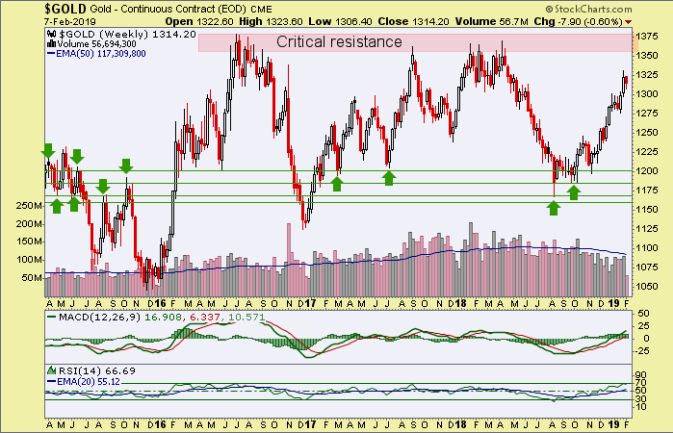
The weekly view of gold dials in the critical resistance zone.
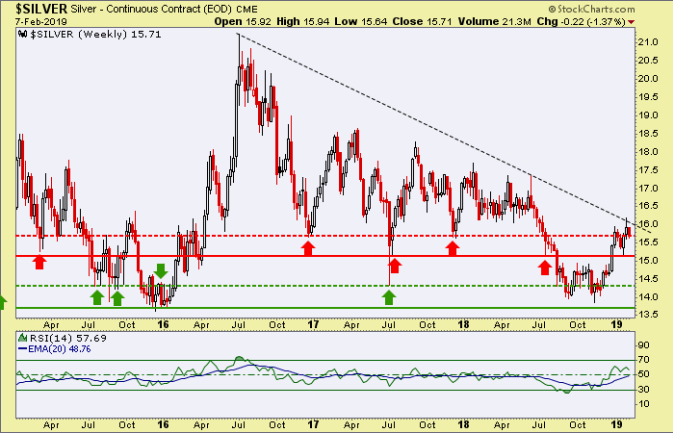
Silver weekly is dealing with a key lateral resistance level, and there again is the trend line that silver bugs are watching closely.
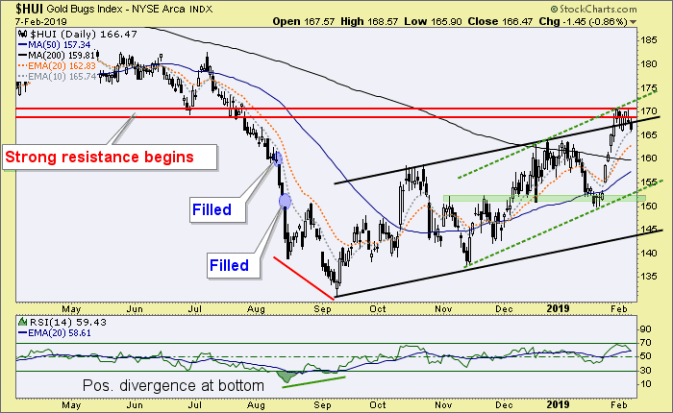
HUI hit its head on the 170 target zone that we have had in play since the rally began. It is a logical point for an overbought index to pull back from, but if we are talking new bull market here we should also realize that part of its job would be to do the unexpected because part of its job would be to leave as many true believers on the sidelines as possible.
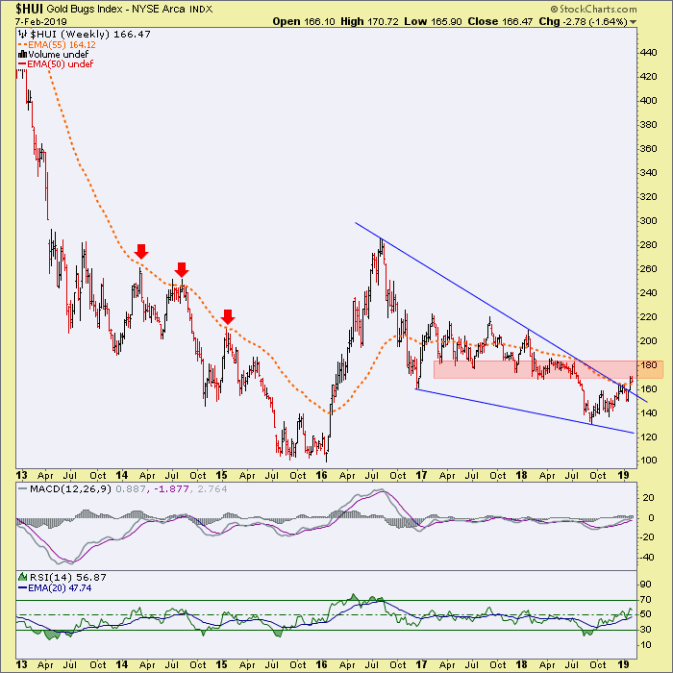
HUI weekly has broken the equivalent trend line we noted for silver above. It has also busted the old “bear market ball & chain” as I used to call it. That would be the (orange dashed) weekly EMA 55, which resisted every bounce attempt and kept us safe from the bear. Note the thick overhead resistance that Huey is now probing.
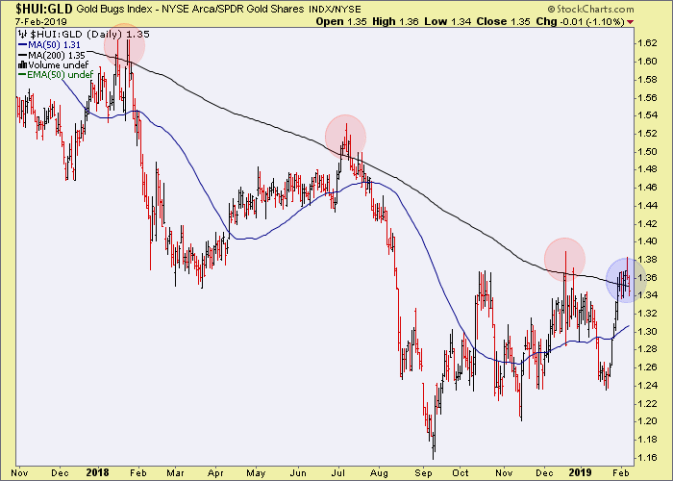
Finally, the HUI/Gold ratio (daily) has not yet made a bullish signal. The major trend is still down and until that changes, we should hold discipline and patience. Again, a bull market signal could be made at any time but as of this moment, that time has not arrived.
Bottom Line
The macro is in motion now with gold regaining some of its mojo because the macro fell apart in Q4 2018. The relief was always going to come and it is here. The key will be whether it remains just ‘relief’ or re-bulls into something more.
If it is just a final kiss goodbye for the cyclical, risk ‘on’ world, some of the as yet un-triggered bull signals will likely trigger for the gold sector.
If the cyclical world re-bulls well, party on Garth, party on Wayne and send the gold bugs back to Pallookaville.
If the initial thrust of Q4 2018 gets follow-through, that is likely all the precious metals will need to begin a bull market of some kind, whether for a relatively short cycle or something bigger.
