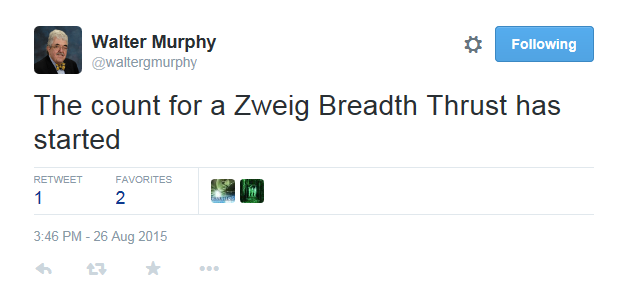
As the stock market is in bounce mode since the market bottom last week, a rare but powerful bull market signal may be brewing. I am indebted to Walter Murphy who tweeted a possible setup for a Zweig Breadth Thrust buy signal last week:
The Zweig Breadth Thrust is sort of an IBD follow-through day pattern, but on steroids. Steven Achelis at Metastock explained the indicator this way (emphasis added):
A "Breadth Thrust" occurs when, during a 10-day period, the Breadth Thrust indicator rises from below 40% to above 61.5%. A "Thrust" indicates that the stock market has rapidly changed from an oversold condition to one of strength, but has not yet become overbought. According to Dr. Zweig, there have only been fourteen Breadth Thrusts since 1945. The average gain following these fourteen Thrusts was 24.6% in an average time-frame of eleven months. Dr. Zweig also points out that most bull markets begin with a Breadth Thrust.
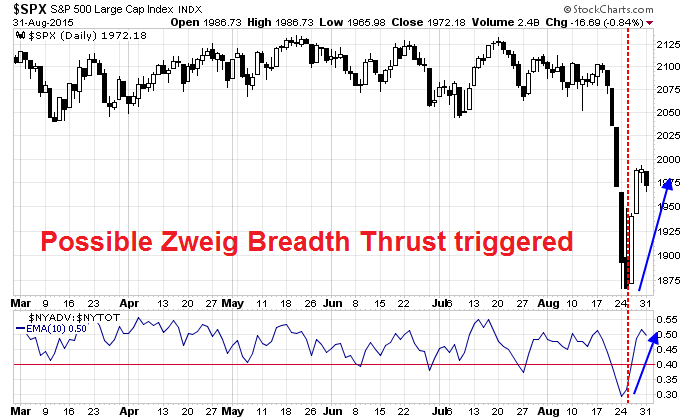
The Breadth Thrust is a rare but powerful bull signal that presages significant gains ahead for the stock market, should its conditions be satisfied. Day 0 was last Tuesday, August 25. Here is the chart of the S&P 500 so far. The Breadth Thrust Indicator has 10 trading days to accomplish its task of getting over 61.5%:
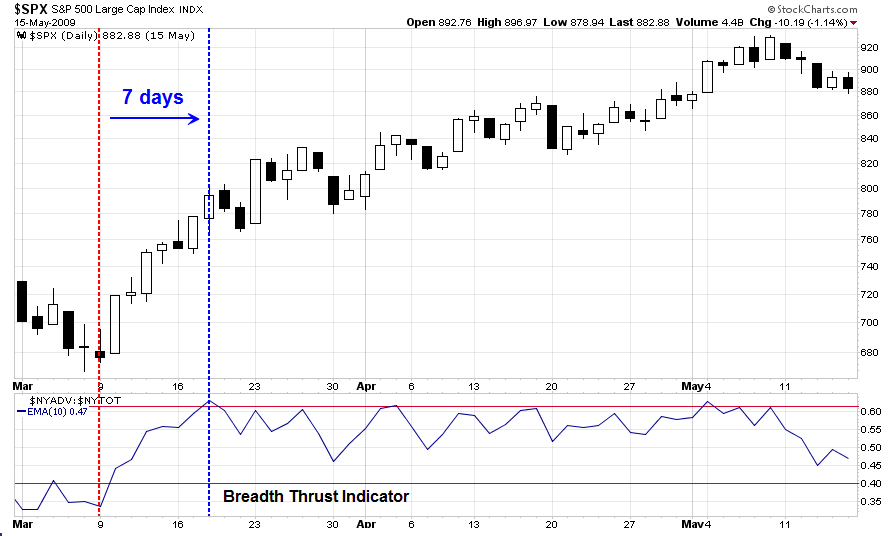
An example of the Zweig Breadth Thrust buy signal occurred at the market bottom in 2009. Then, it took seven days for the indicator to complete its task:
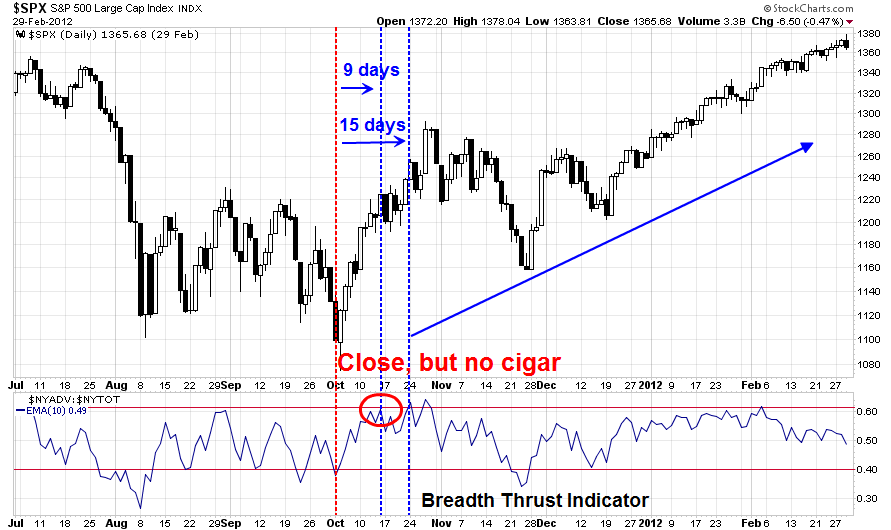
To be sure, not all setups turn into buy signals, but failed setups are not necessarily bearish either. Here is an example from 2011, when the SPX corrected, chopped around for a few weeks and flashed a Zweig buy signal setup. The Breadth Thrust Indicator almost achieved a buy signal in the 10 day window on day 9, but missed.
It did manage to get over the 61.5% mark on day 15 - too late. Nevertheless, the market did bottom out that summer and proceeded to rise steadily for the next four years - until the recent correction.
As Zweig Breadth Thrust signals are very rare, I am not counting on the current episode to flash a buy signal, which would be indicative of a V-shaped bottom. The bulls do have the help of the magazine cover (contrarian) indicator in its favor. The latest Businessweek cover is full of bears:

The fear in the stock market has also made it to the cover of The New Yorker:
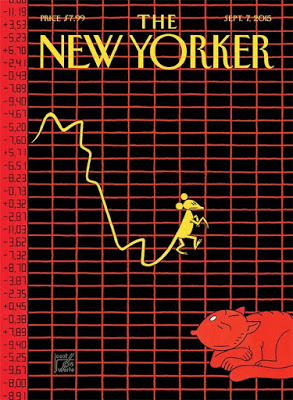
The market will have a difficult task of showing tremendous strength for the Zweig Breadth Thrust indicator to confirm a bullish reading. For a sense of the sheet scale of the rally, here are some numbers:
- If the rally is the same scale as it was in 2009, then an equivalent level for the SPX would be 2163, which would represent an all-time-high.
- If the rally in 2011 had hit its 61.5% target in 9 days, then the SPX would have to get to 2072.
- If the rally in 2011 had hit its 61.5% target within the 10 day window instead of 15 days that it did, then the SPX would have to get to 2130, or a test of the previous highs.
None of these targets are easy, but the two lower ones are somewhat plausible and possibly achievable. I will be monitoring this indicator and report back should it flash a buy signal, on or before the end of the 10 trading day window.
Disclosure: Cam Hui is a portfolio manager at Qwest Investment Fund Management Ltd. ("Qwest"). This article is prepared by Mr. Hui as an outside business activity. As such, Qwest does not review or approve materials presented herein. The opinions and any recommendations expressed in this blog are those of the author and do not reflect the opinions or recommendations of Qwest.
None of the information or opinions expressed in this blog constitutes a solicitation for the purchase or sale of any security or other instrument. Nothing in this article constitutes investment advice and any recommendations that may be contained herein have not been based upon a consideration of the investment objectives, financial situation or particular needs of any specific recipient. Any purchase or sale activity in any securities or other instrument should be based upon your own analysis and conclusions. Past performance is not indicative of future results. Either Qwest or Mr. Hui may hold or control long or short positions in the securities or instruments mentioned.

