It’s not exactly a secret – and it’s a widely misunderstood concept – but in the world of investing sometimes it’s not what you invest in but when that matter most.
Case in point. What do you get when you combine junk bonds, dividend stocks and intermediate-term treasury notes?
It depends on how you do it.
We will look at two approaches – one approach buys and holds all three with an annual rebalance, the other switches between the three using a set calendar.
Spoiler Alert: The difference is “stark.”
(See Also JayOnTheMarkets.com: The World is at a Critical Juncture)
The Vehicles
For our purposes, we will conduct two tests from 12/31/1989 through 3/31/2018 using the following set of monthly total return data:
Junk Bonds: From 12/31/1989 through 12/31/1993 we use Vanguard High-Yield Corporate Inv. From 12/31/1993 forward we use the Barclays Capital High Yield Very Liquid Index (which is the index that is tracked by the SPDR Barclay High Yield Bond (NYSE:JNK))
Dividend Stocks: We use the S&P 500 Dividend Aristocrats Index (which is the index used by the ProShares S&P 500 Dividend Aristocrats (NYSE:NOBL))
Intermediate-Term Treasuries: We use the Barclay Capital U.S. 3-7 Year Treasury Bond Index (which is the index tracked by the iShares 3-7 Year Treasury Bond (NASDAQ:IEI))
Test 1 – The “Equal Split” Approach
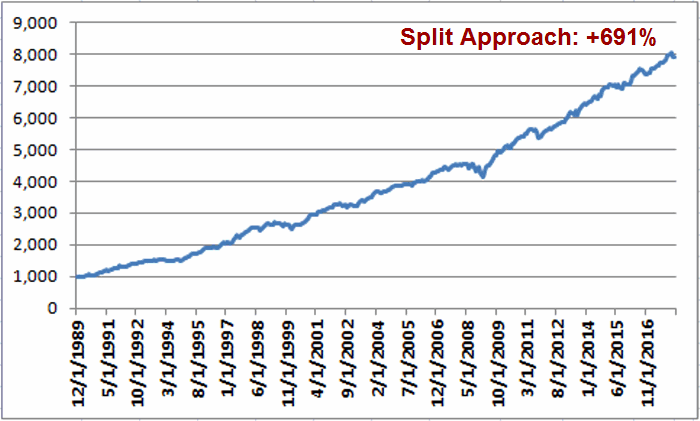
For this test we simply split our money evenly between junk bonds, dividend stocks and intermediate-term treasuries and rebalance at the end of each year. Figure 1 displays a graph of the cumulative growth of $1,000 since 12/31/1989.
Figure 1 – Growth of $1,000 split between Junk bonds, dividend stocks and intermediate-term treasuries with an annual rebalance; 12/31/1989-3/31/2018
The results look pretty good in terms of consistency. The total return is +691% (about 7.8% for the 12-month average) with a maximum drawdown of -9.2%
Can these results be improved upon? (Another Spoiler Alert: Yes, by a factor of about 8-to-1.)
Test 2 – The “Calendar Approach”
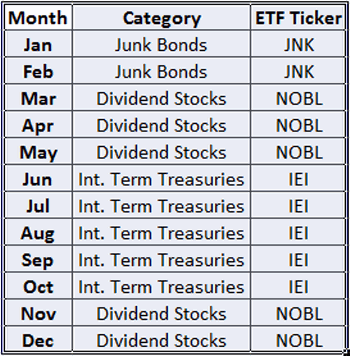
With this approach we will invest in only one category per month each year as displayed in

Figure 2 – Calendar Approach Investment Calendar
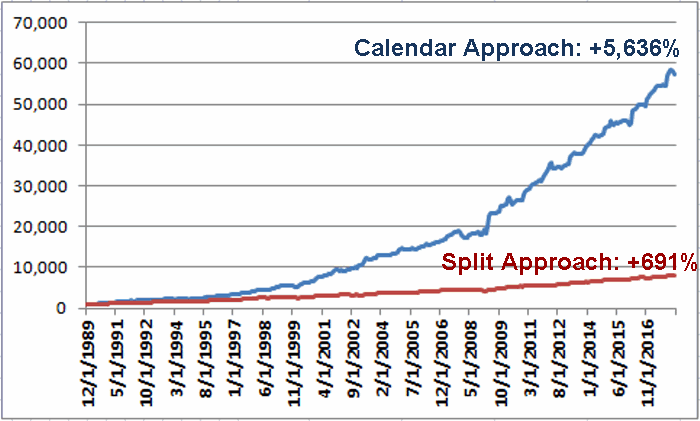
The results for Test 2 appear in Figure 3 as the blue line. For comparisons sake, the original line that appeared in Figure 1 appears in Figure 3 as the red line. Notice a difference?

Figure 3 – Growth of $1,000 invested using Calendar Approach (blue line) versis Split Approach (red line); 12/31/1989-3/31/2018
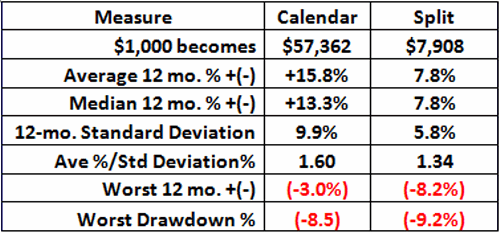
The particulars of relative performance appear in Figure 4.

Figure 4 – Performance Comparison; Calendar Approach vs. Split Approach; 12/31/1989-3/31/2018
Summary
For the record I am not “recommending” this as an investment approach. Like any other approach there a relative pros and cons that would need to be carefully considered before adopting such an approach using one’s actual hard earned money. For example, these returns involve the use of index data and do not represent actual trading results and there are no deductions for any fees, etc.
The material presented above is intended simply to highlight:
Jay’s Trading Maxim #44: Sometimes it’s not what you invest in but when that matters most.
Case in point.
Disclaimer: The data presented herein were obtained from various third-party sources. While I believe the data to be reliable, no representation is made as to, and no responsibility, warranty or liability is accepted for the accuracy or completeness of such information. The information, opinions and ideas expressed herein are for informational and educational purposes only and do not constitute and should not be construed as investment advice, an advertisement or offering of investment advisory services, or an offer to sell or a solicitation to buy any security.
