T2108 Status: 85.9%
T2107 Status: 35.7%
VIX Status: 17.4
General (Short-term) Trading Call: cautiously bullish
Active T2108 periods: Day #17 over 20%, Day #16 over 30%, Day #13 over 40%, Day #10 over 50%, Day #6 over 60%, Day #5 over 70%, Day #3 over 80% (overbought)

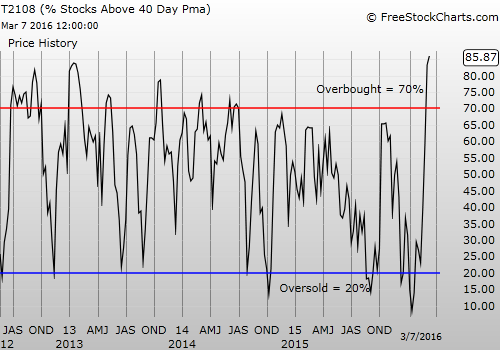
Many of the speculative run-ups I described in the last T2108 Update continued to start trading this week. T2108, the percentage of stocks trading above their respective 40-day moving averages (DMAs) managed to eke out yet another daily gain to close at 85.9%. T2107, the percentage of stocks trading above their respective 200DMAs, further supported the on-going bullish mood with its fifth straight gain to close at 35.7%. T2107 has declined only TWO days since the February 11th bottom at oversold trading conditions; T2108 has experience three down days over this span. The S&P 500 (SPDR S&P 500 (NYSE:SPY)) once again obscured the underlying bullishness, this time with an imperceptible 0.09% gain.
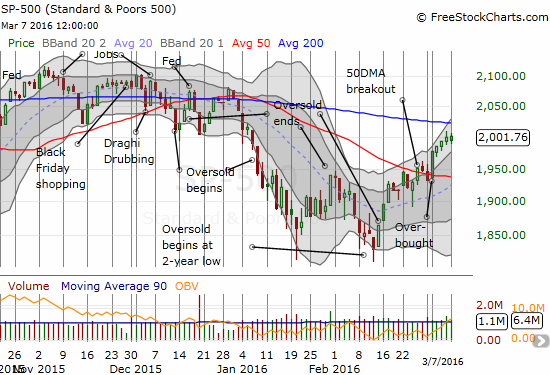
The S&P 500 practically stood in place on the day despite underlying bullishness across the market.
The volatility index even gained for a second day in a row although it faded strongly off intraday highs.
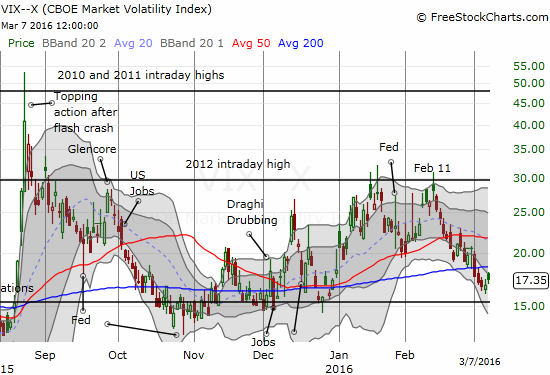
The volatility index is trying to make a small, yet contrary, stand.
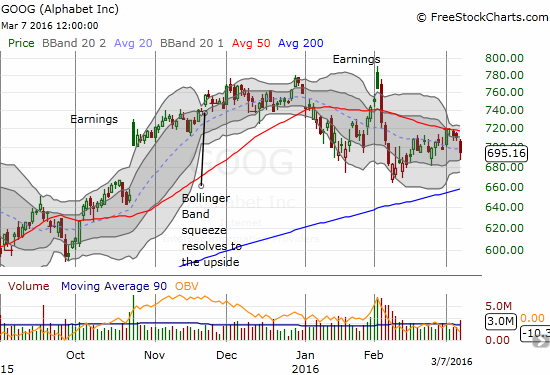
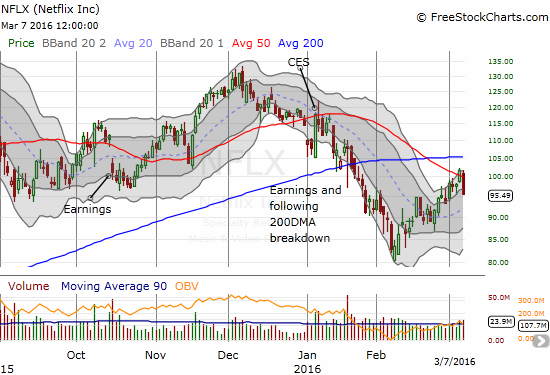
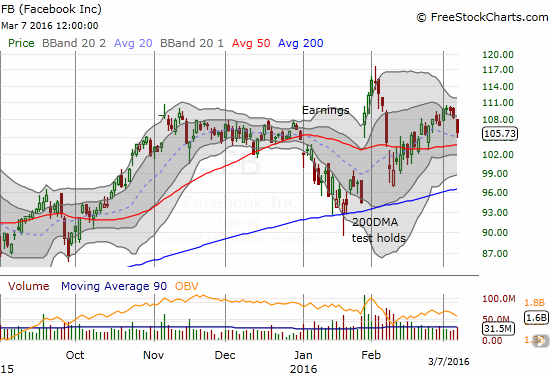
The big obstacle for the market on the day was the simultaneous failure of the big internet stocks to break through resistance at their respective 50DMAs. These same stocks had led market sentiment and pushed the indices despite underlying technical weakness last year. Now, these big boys are failing to carry their weight. The parallel nature of these failures is eye-catching…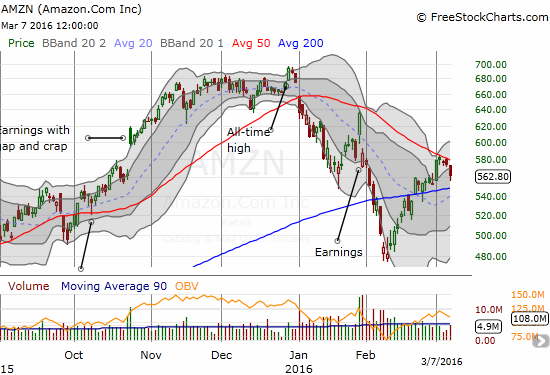
Amazon.com (NASDAQ:AMZN) dropped 2.2% as staunch resistance at the 50DMA sent the stock on a near reversal of last week’s big one-day gain.
Alphabet Inc C (NASDAQ:GOOG) added its own 50DMA failure to the mix. Last week’s gains are already gone.
Yep. Yet another important 50DMA failure. Netflix (NASDAQ:NFLX) went from a 50DMA breakout the previous day to a 50MDA breakdown. At least the uptrend channel from February lows remains intact.
Facebook (NASDAQ:FB) gets honorable mention. It is the one big internet stock that has been strong enough to sustain trading above its 50DMA. It is still in “full bull” mode. It lost 2.5% for a third straight day of losses.
I am startled to see these (former) leaders all struggle in the past several days while the underlying bullishness of the market marches forward. It is of course very possible that traders are taking profits in these names to fund speculation elsewhere in the market. If these market leaders continue to wane from 50DMA resistance, and especially if some start to breach 200DMA support, I will have to raise the same yellow flag I would raise if T2108 suddenly started to wane. I am particularly keen to see whether these stocks start to trade inversely to many of the stocks experiencing strong run-ups right now, especially the commodities-related stocks.
Stay tuned!
Daily T2108 vs the S&P 500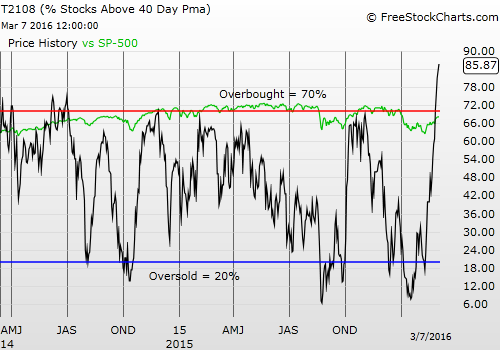
Black line: T2108 (measured on the right); Green line: S&P 500 (for comparative purposes)
Red line: T2108 Overbought (70%); Blue line: T2108 Oversold (20%)
Be careful out there!
Full disclosure: short FB, long FB call options, long CAT put options

