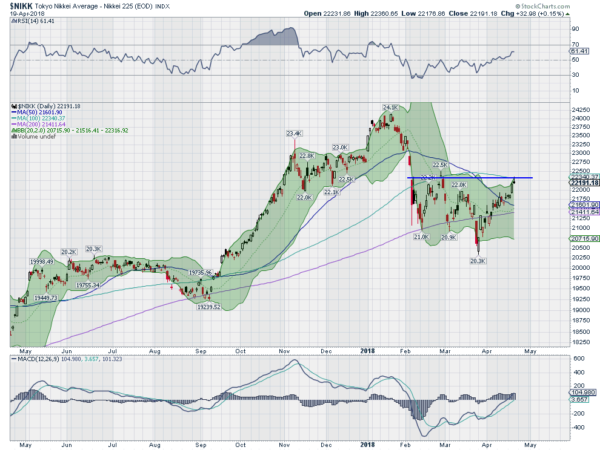
The Japanese stock market peaked in January, just like the US market did. For the Japanese market, it came after a nearly 5 month move to the upside that started after reconnecting with its 200 day SMA. This was a 25% move higher over just that period and capped a very impressive 12 month move up.
But the drop happened very fast. By early February the Nikkei was back at its 200 day SMA, shedding 65% of that move higher. It began to consolidate there, bouncing and finding resistance at the 100 day SMA. Another trip back to the 200 day SMA made for a slightly lower low. This was followed by a lower high and another lower low, now retracing nearly 78.6% of the move to the January high.

That last drop was capped by a gap down out of the Bollinger Bands® and then buying strength all day. And the Nikkei has been moving higher ever since. After a strong run it ended the week just below the top of the consolidation range and at the 200 day SMA. Will it fail again?
There are three indicators to watch that suggest it might be different this time. First, the Nikkei is pushing open the Bollinger Bands as it has moved higher. Second, the RSI is making a higher high and has moved into the bullish zone as it continues higher. Third, the MACD, which has been diverging higher since the February low, has just turned positive. These 3 together show strong momentum without being overbought. The perfect formula for a continued move higher. Now price just has to follow.
DISCLAIMER: The information in this blog post represents my own opinions and does not contain a recommendation for any particular security or investment. I or my affiliates may hold positions or other interests in securities mentioned in the Blog, please see my Disclaimer page for my full disclaimer.
