🐂 Not all bull runs are created equal. November’s AI picks include 5 stocks up +20% eachUnlock Stocks

A Moment Of Clarity For The S&P 500

Published 08/30/2017, 06:54 AM
Updated 07/09/2023, 06:31 AM
US500
-

A week ago I commented on my SPX hourly chart that the obvious target for this move was falling channel resistance and SPX finally hit that at the high yesterday. After the confused mess of the last five days of trading that at last gives a clear setup here.

This falling channel is a likely bull flag which on a break up would have a minimum target at a retest of the all time high. The rising wedge from the March low has already retraced over 38.2% of the wedge so SPX could break up now into that retest. The open 60 min buy signal likes that option and arguably so does the falling megaphone that has formed on the RSI 14 over the last few days.

On the other hand a reversal here could well still reach the ideal 50% retracement target at 2405 that I gave at the end of July. Channel support is now in the 2395 area and a little low for that but there are a couple of alternate falling wedge support trendline options that could deliver a low close to that number.

When does this flag channel break? I’m leaning towards a lower low in my target area first but it could go either way and price will decide, likely today. A break up might well take the form of a gap up over flag channel resistance. We will see. SPX 60 min chart:
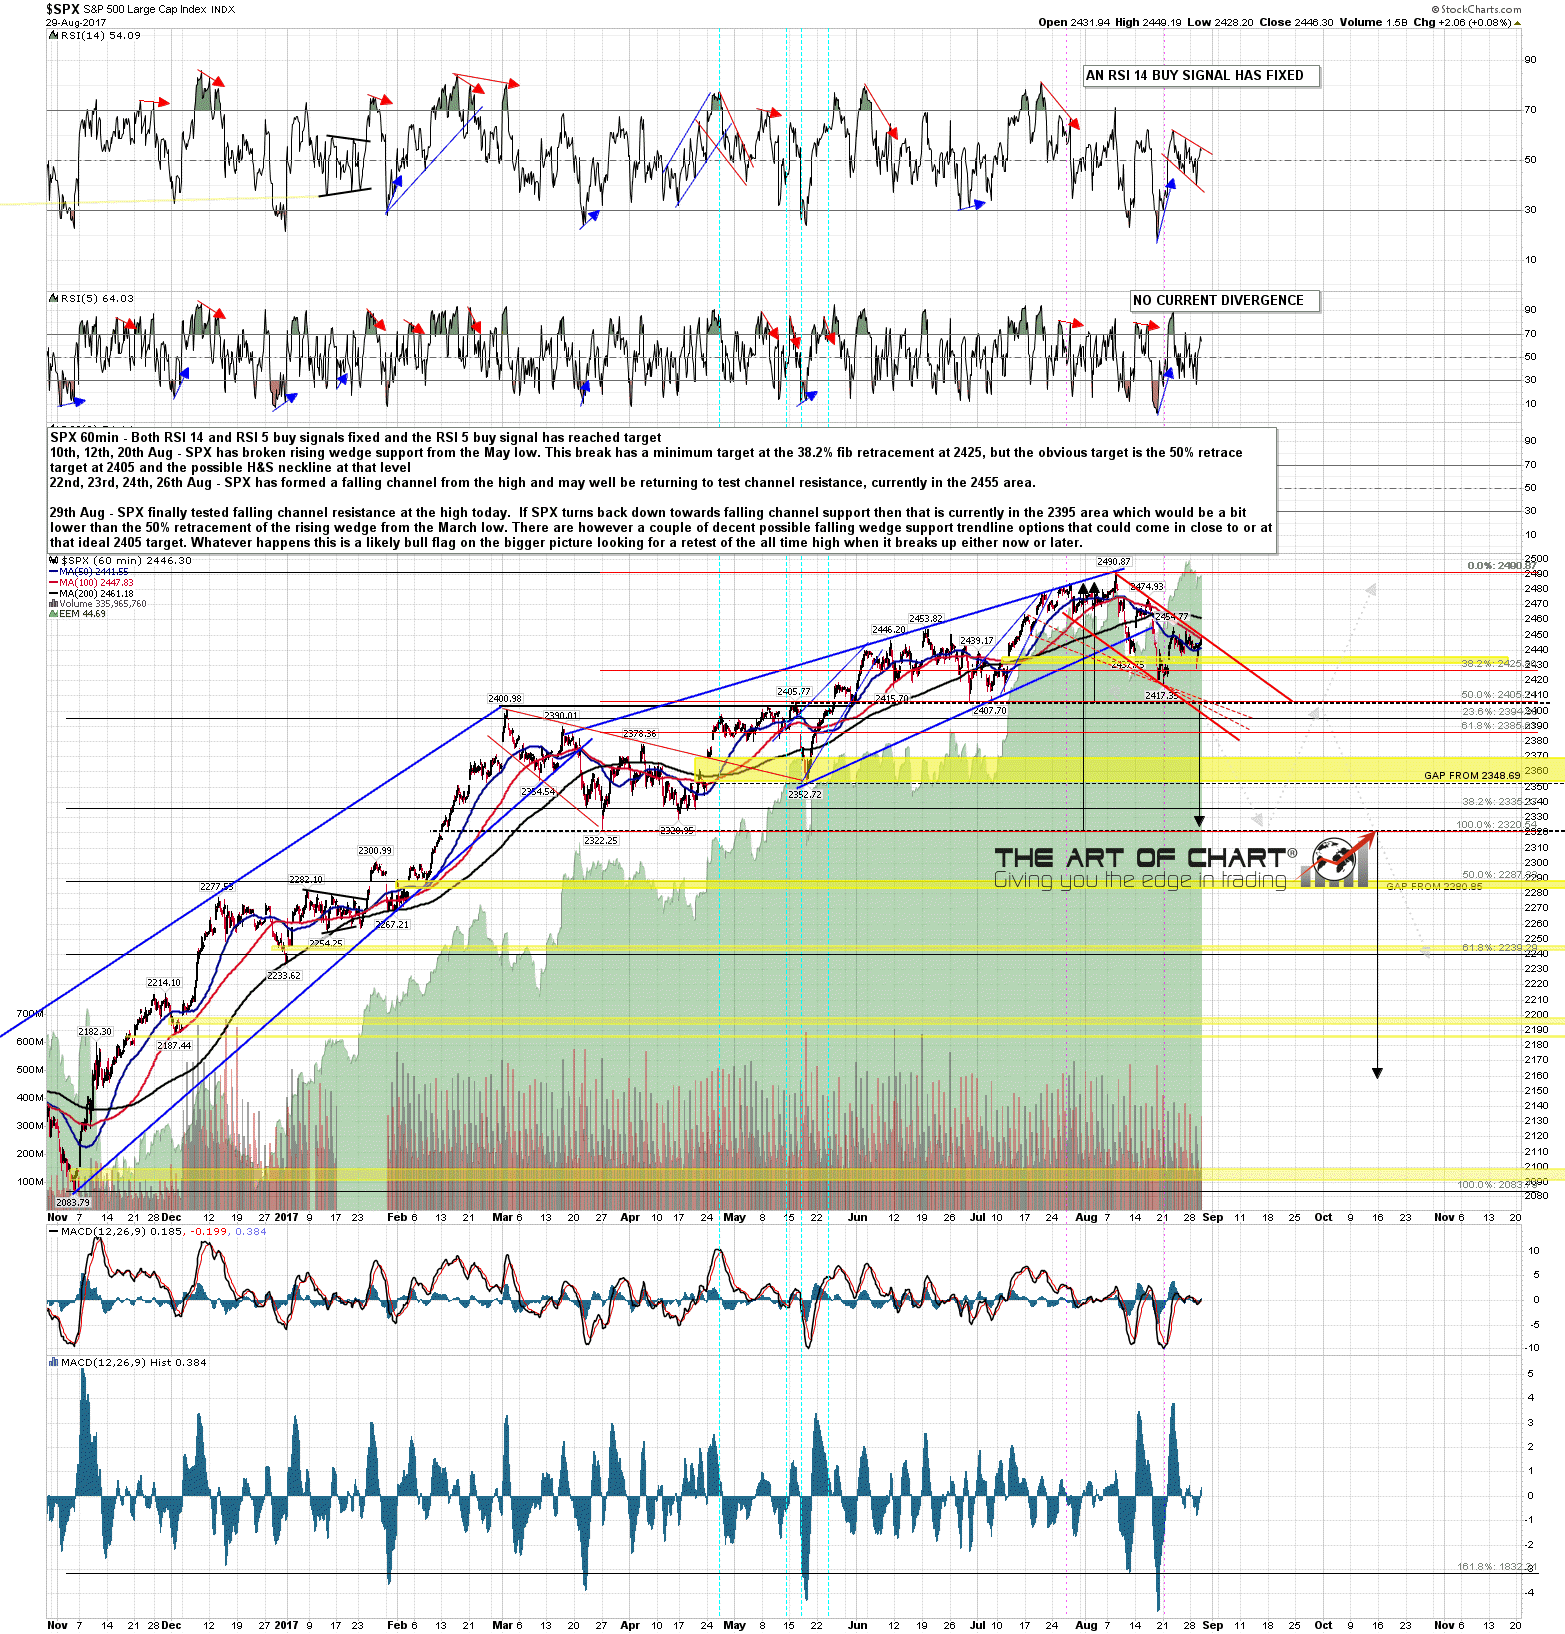
 SPX 60 min Chart

There is important resistance just above at the daily middle band of course and that closed yesterday in the 2454.4 area. Bulls also need to break and convert that to support on a daily closing basis. I would also note that main rising wedge support from the February 2016 low is now in the 2380 area, and if SPX is heading back to falling channel support, then that would also be a decent match with the 61.8% fib retracement of the rising wedge from the March low in the 2385 area.

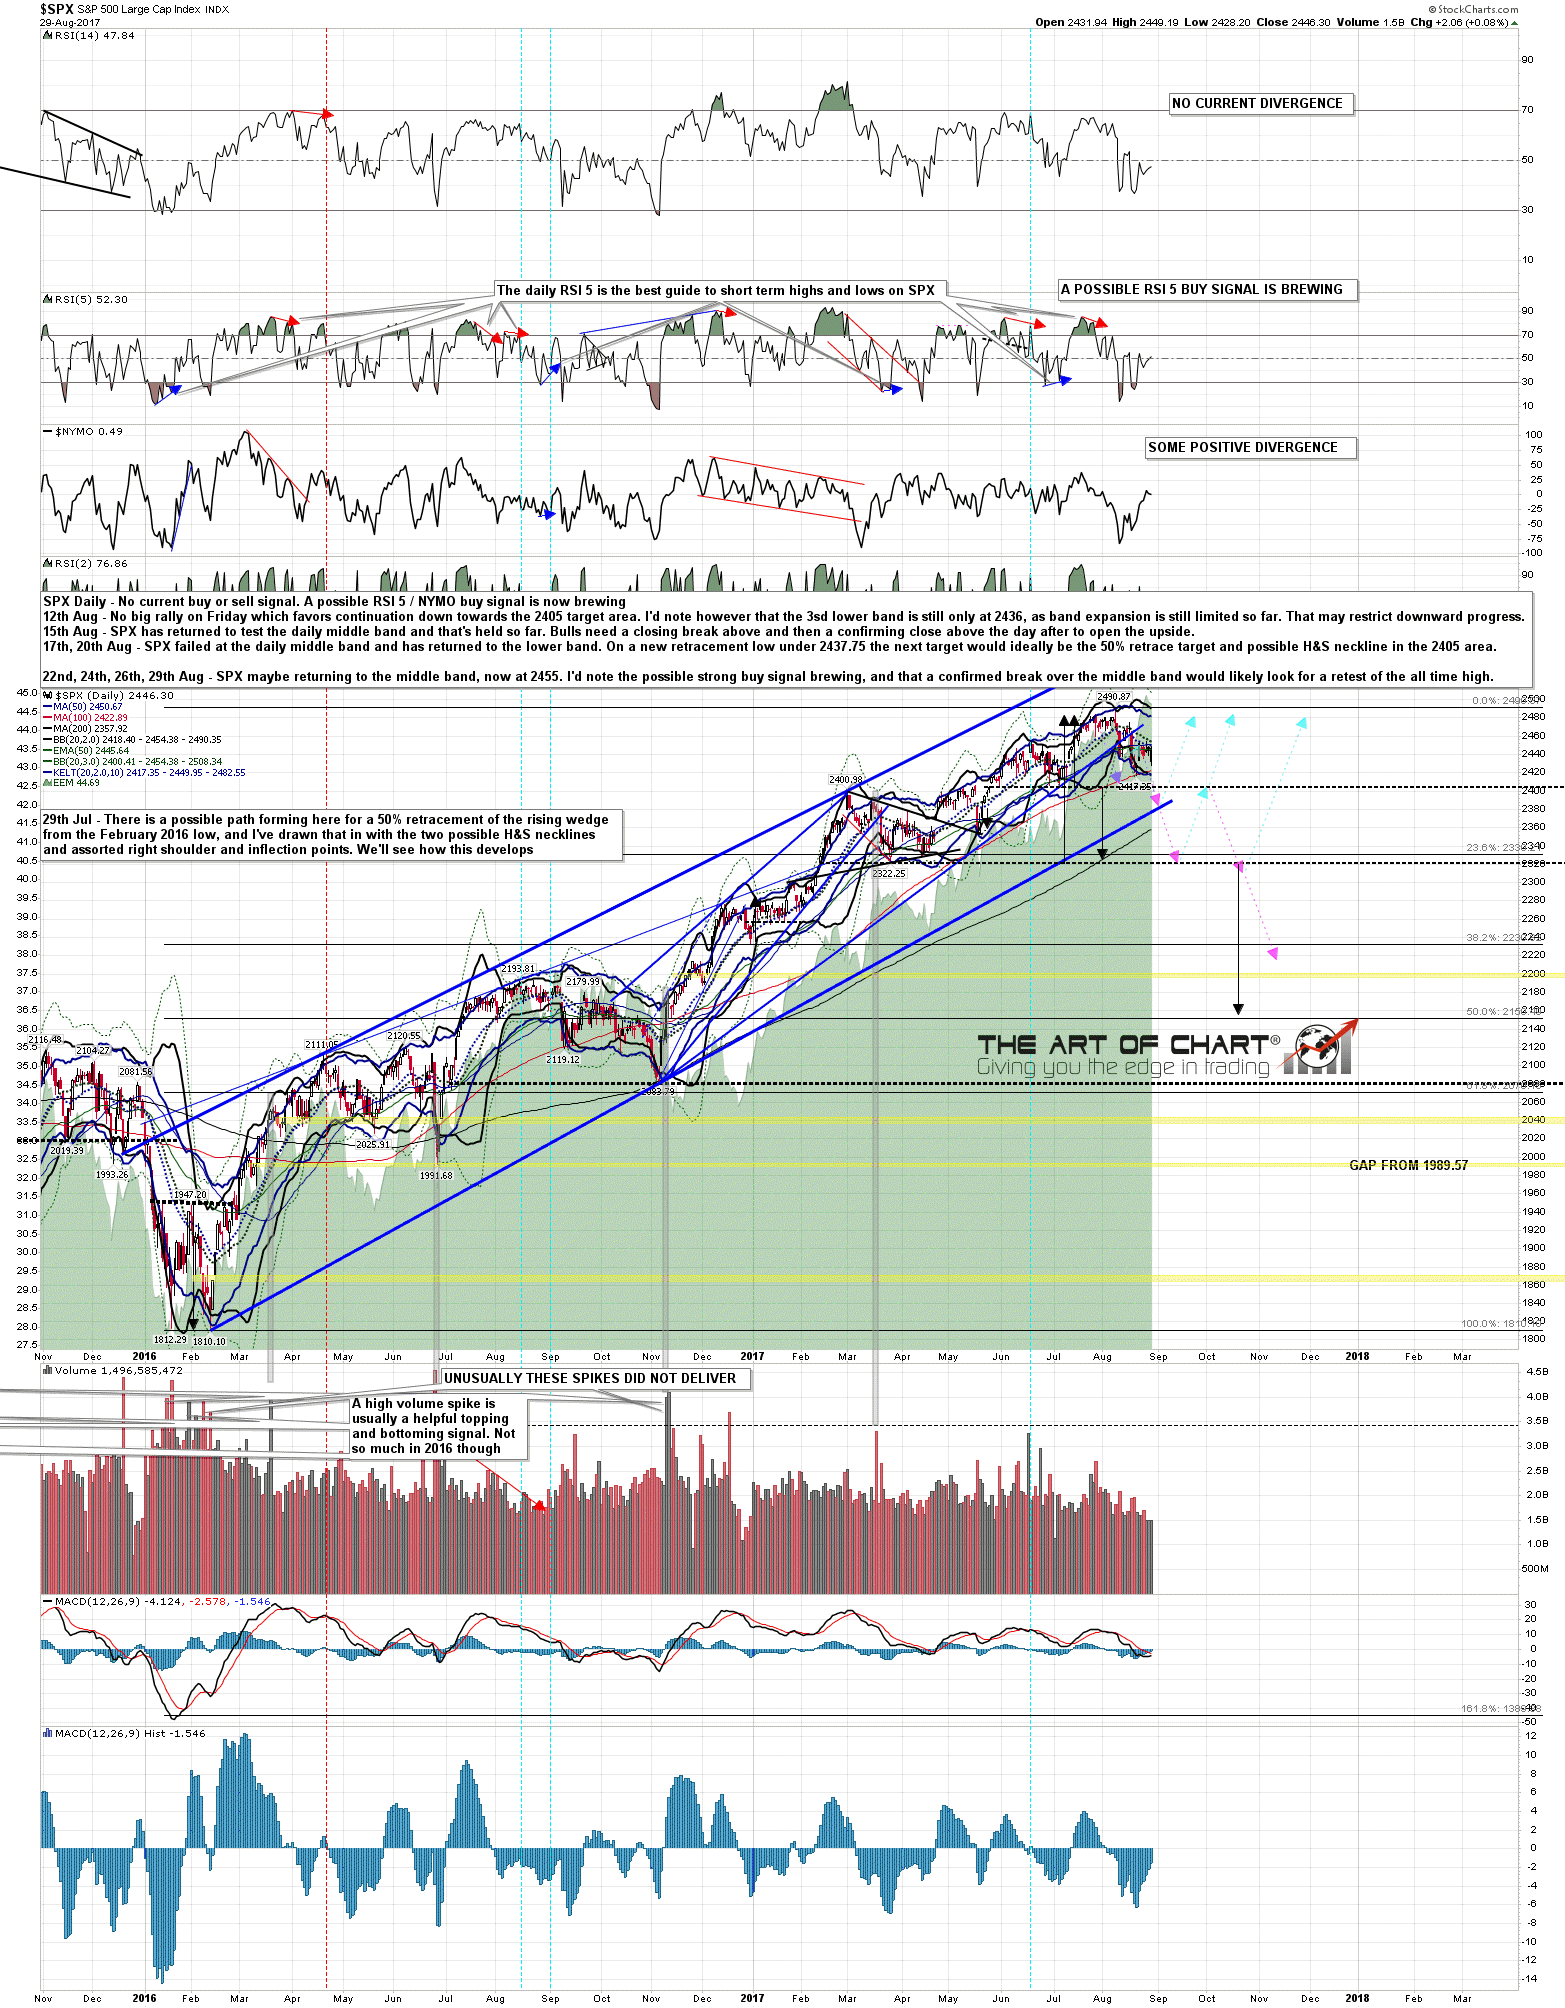
SPX Daily Chart

Latest comments

Loading next article…
Risk Disclosure: Trading in financial instruments and/or cryptocurrencies involves high risks including the risk of losing some, or all, of your investment amount, and may not be suitable for all investors. Prices of cryptocurrencies are extremely volatile and may be affected by external factors such as financial, regulatory or political events. Trading on margin increases the financial risks.
Before deciding to trade in financial instrument or cryptocurrencies you should be fully informed of the risks and costs associated with trading the financial markets, carefully consider your investment objectives, level of experience, and risk appetite, and seek professional advice where needed.
Fusion Media would like to remind you that the data contained in this website is not necessarily real-time nor accurate. The data and prices on the website are not necessarily provided by any market or exchange, but may be provided by market makers, and so prices may not be accurate and may differ from the actual price at any given market, meaning prices are indicative and not appropriate for trading purposes. Fusion Media and any provider of the data contained in this website will not accept liability for any loss or damage as a result of your trading, or your reliance on the information contained within this website.
It is prohibited to use, store, reproduce, display, modify, transmit or distribute the data contained in this website without the explicit prior written permission of Fusion Media and/or the data provider. All intellectual property rights are reserved by the providers and/or the exchange providing the data contained in this website.
Fusion Media may be compensated by the advertisers that appear on the website, based on your interaction with the advertisements or advertisers.
© 2007-2024 - Fusion Media Limited. All Rights Reserved.