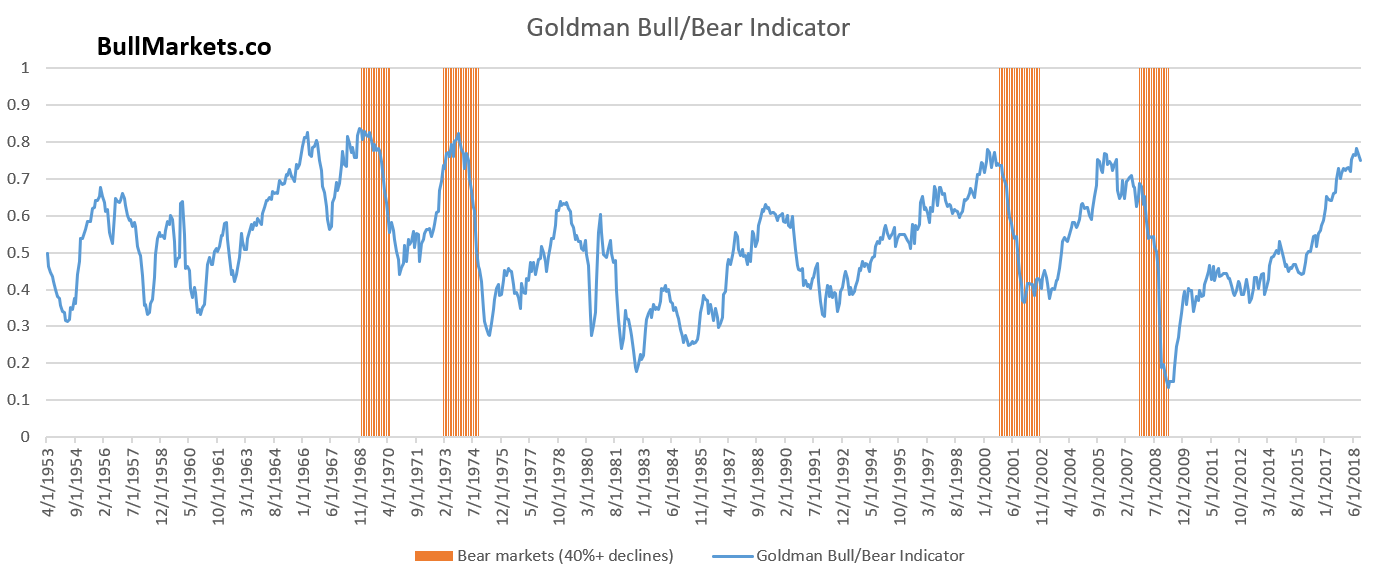
As the bull market and economic expansion ages, the current economic expansion is soon going to be tied for the longest economic expansion in history. Of course economic expansions and bull markets don’t die of old age – they die when leading economic indicators deteriorate significantly.
We are seeing signs of deterioration now, but they are not significant yet.
Go here to understand our fundamentals-driven long term outlook.
Let’s determine the stock market’s most probable medium term direction by objectively quantifying technical analysis. For reference, here’s the random probability of the U.S. stock market going up on any given day.

*Probability ≠ certainty. Past performance ≠ future performance. But if you don’t use the past as a guide, you are blindly “guessing” the future.
Heavy Truck Sales: macro deterioration?
Heavy Truck Sales were high, and are starting to fall right now.
*Heavy Truck Sales are a leading indicator for the stock market and economy.
Over the past half year, Heavy Truck Sales have fallen more than -50k from a high of more than 500k
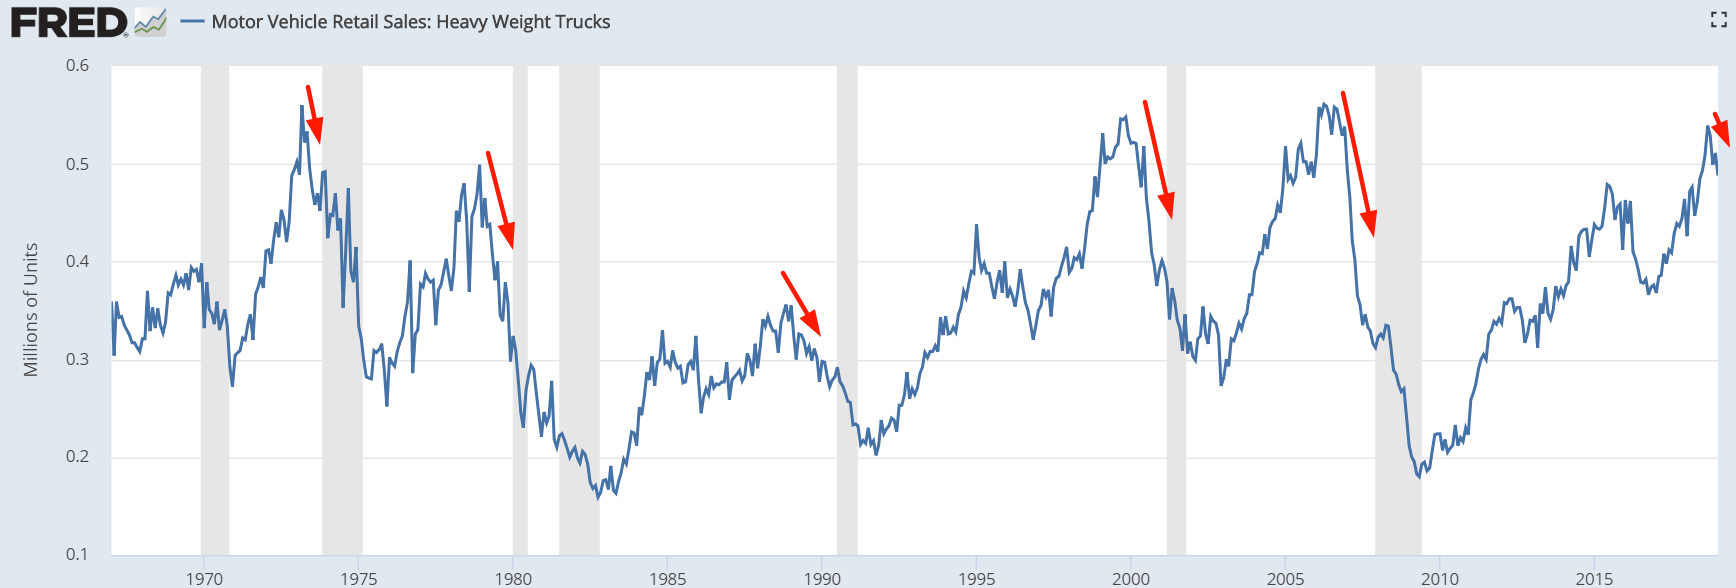
Historically, this happened near major bull market tops:.
- January 2007 (10 months before the bull market ended)
- April 2000 (5 months before the bull market ended)
- June 1973 (6 months after the previous bull market’s top was already in).
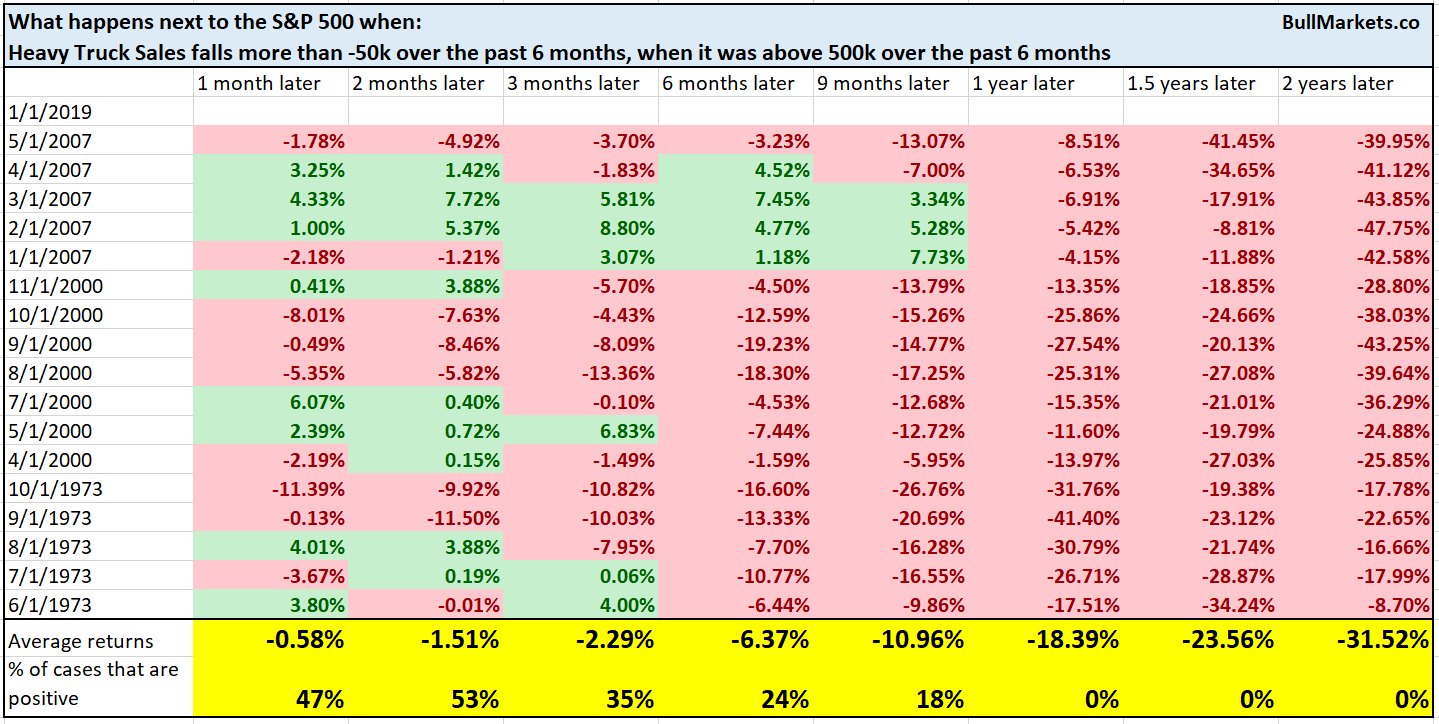
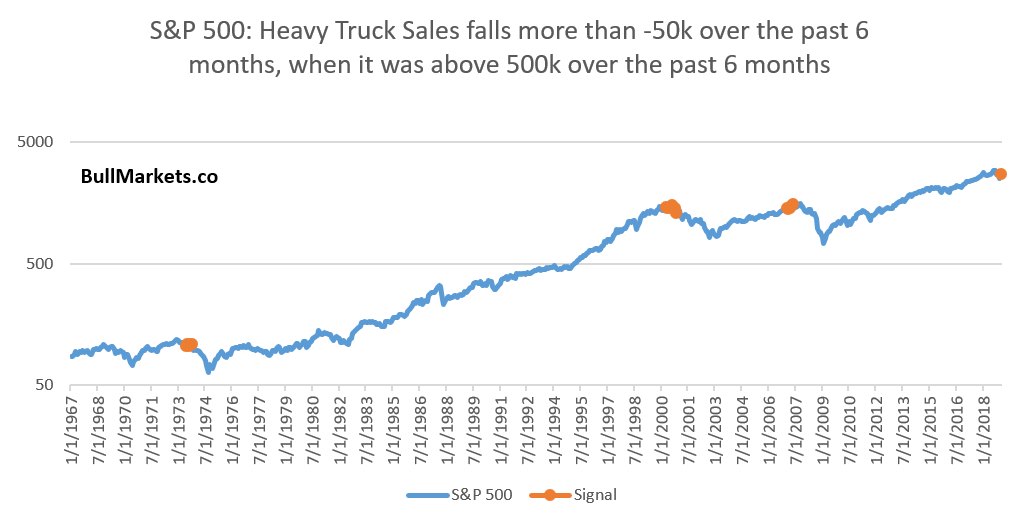
This is not a massively long term bearish sign right now for U.S. stocks. But if Heavy Truck Sales keep trending downwards, then long term bulls should watch out.
Labor
While Heavy Truck Sales has fallen a little bit, Initial Claims is trending sideways/upwards. The upwards trend is barely noticeable, so this is not yet a major long term concern. But watch out if it worsens.

The 3 month moving average for Initial Claims is higher than where it was 4 months ago, while Initial Claims is under 250,000 (i.e. late-cycle).
This is a long-term warning sign for stocks. This happens at the start of some bear markets (e.g. 1973, 1969), but also has some false bearish signals.
For a more accurate reading, wait for Initial Claims to deteriorate even more.
We can loosen the parameters and look at the cases in which Initial Claims was under 300,000 instead of 250,000
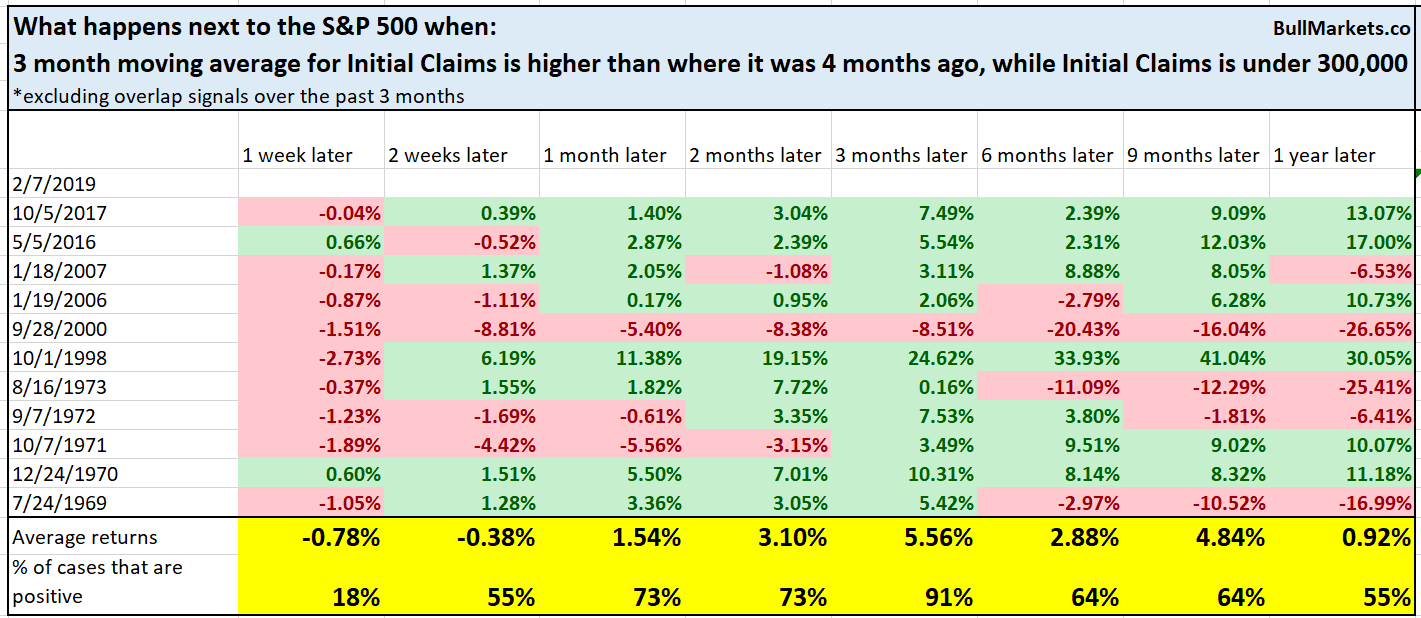
Once again, you can see that this happens in a lot of late-cycle cases.
AAII
Sentiment turned more bullish over the past week. AAII Bulls increased by more than 8% while AAII Bears decreased by more than 8%.
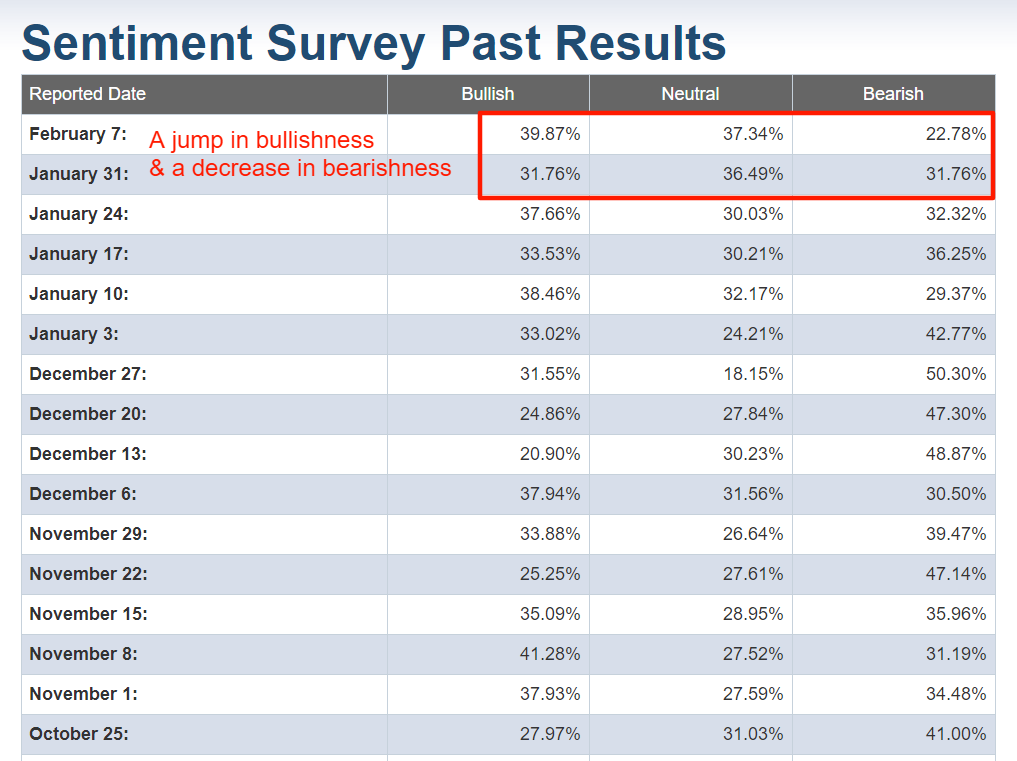
What does this mean for stocks?
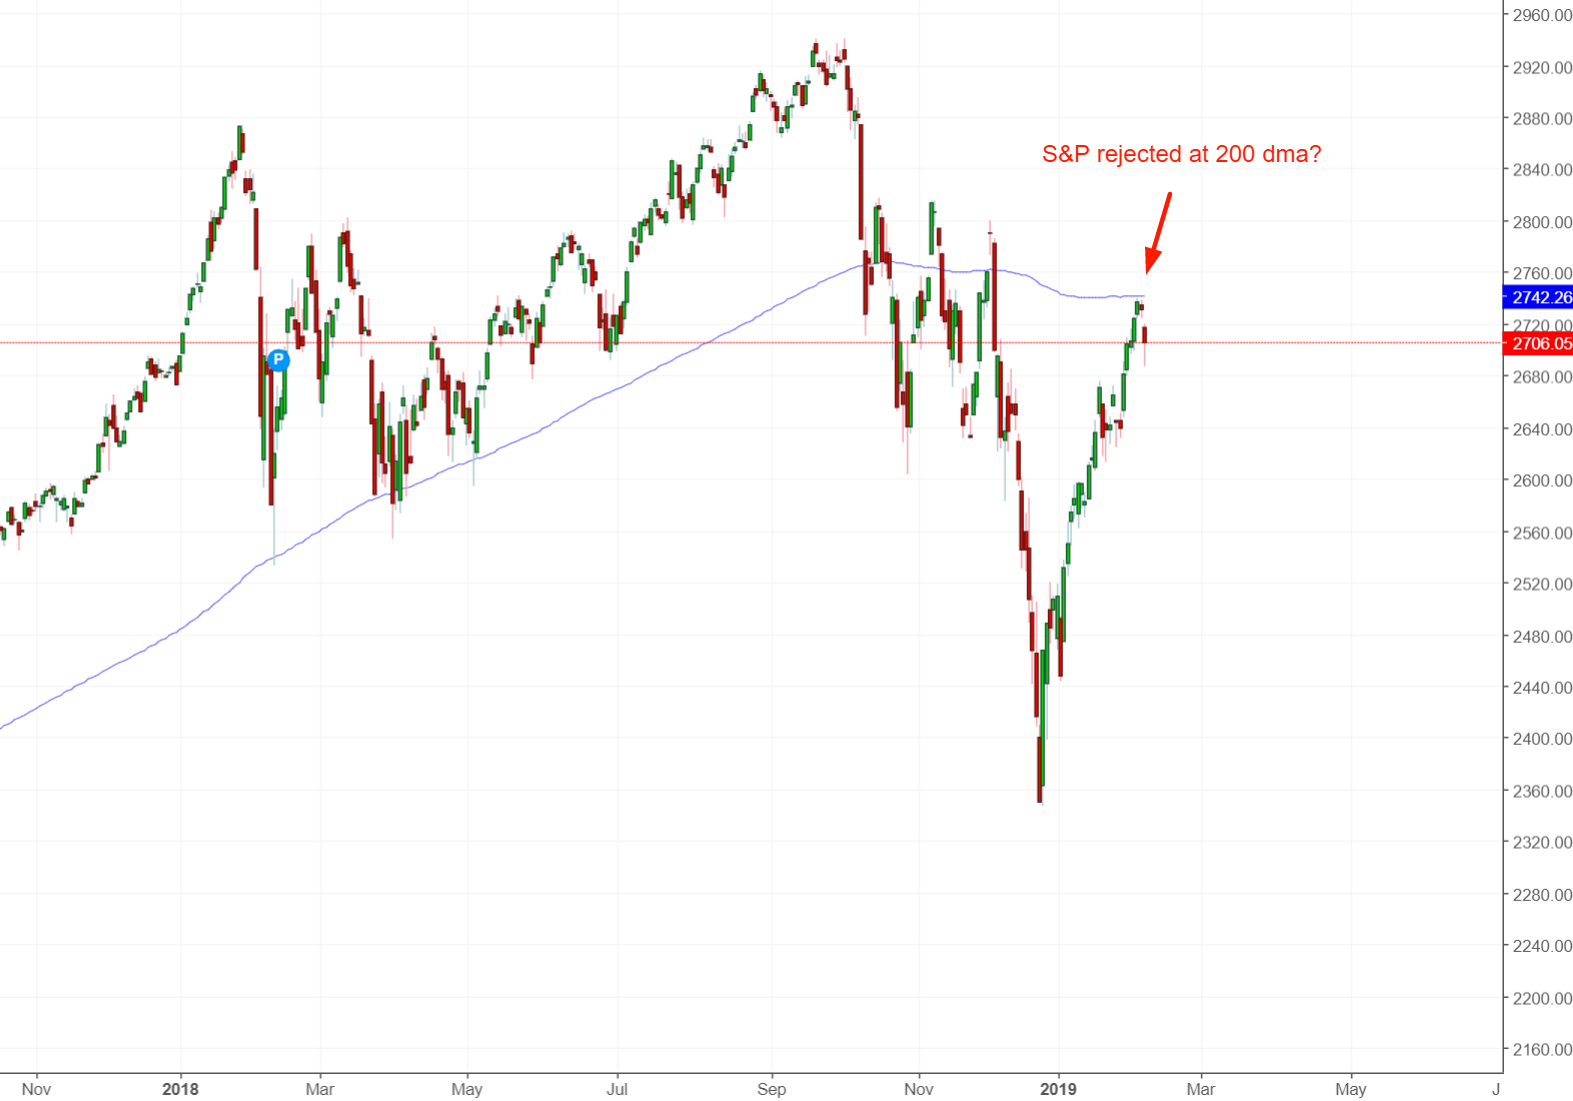
Here’s what happens next to the S&P 500 when AAII Bulls increases by more than 8% and Bears decreases by more than 8%, while the S&P is under its 200 dma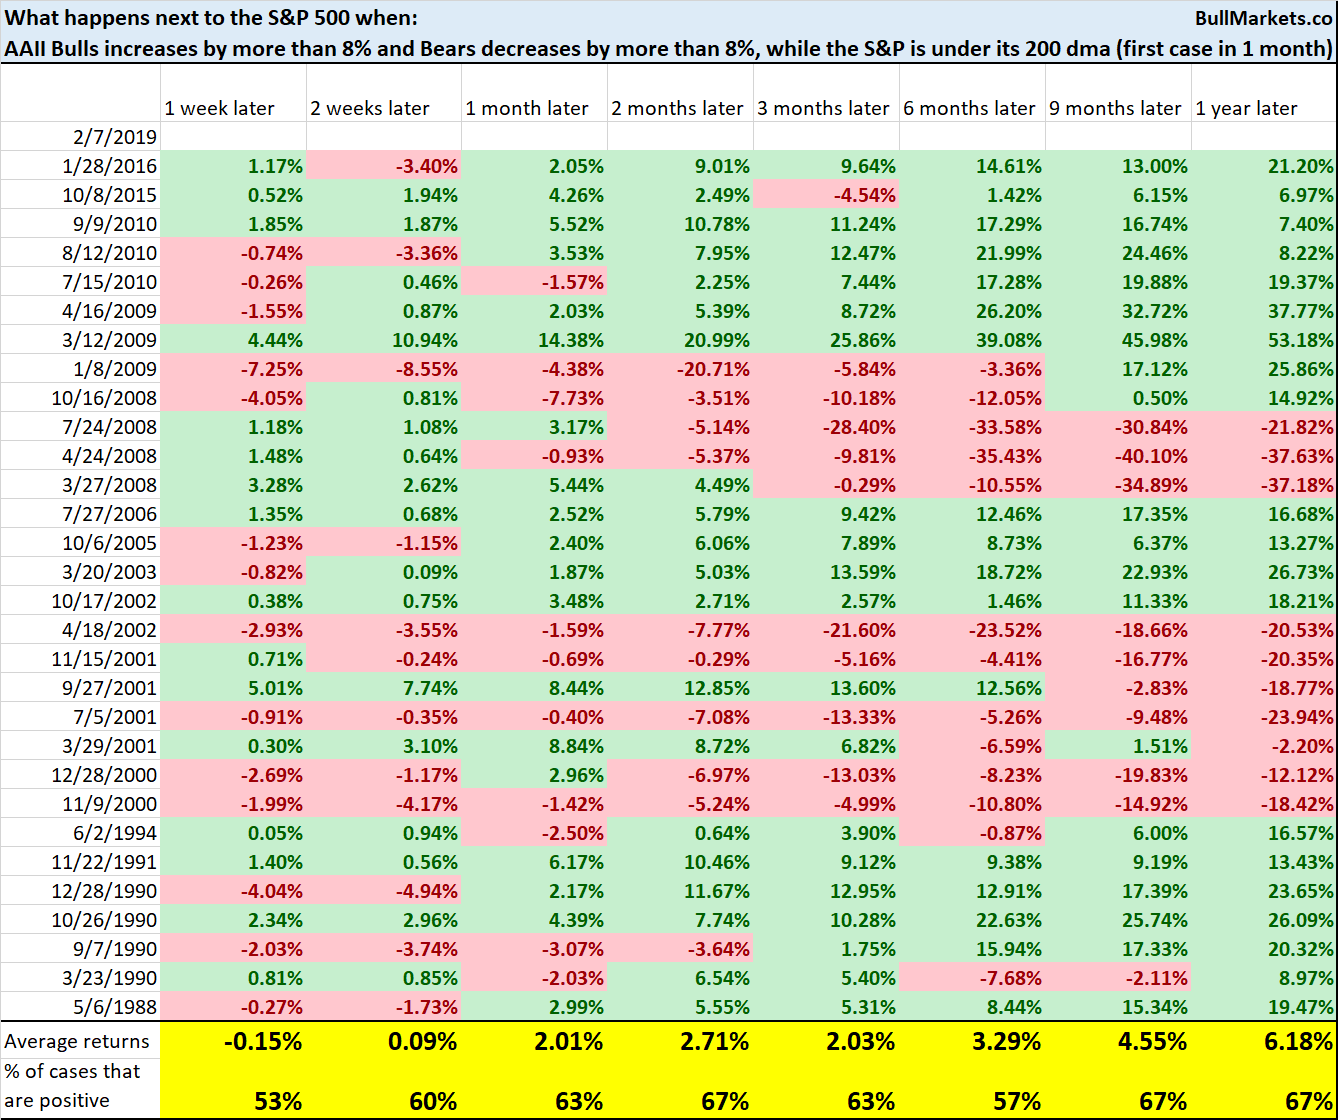
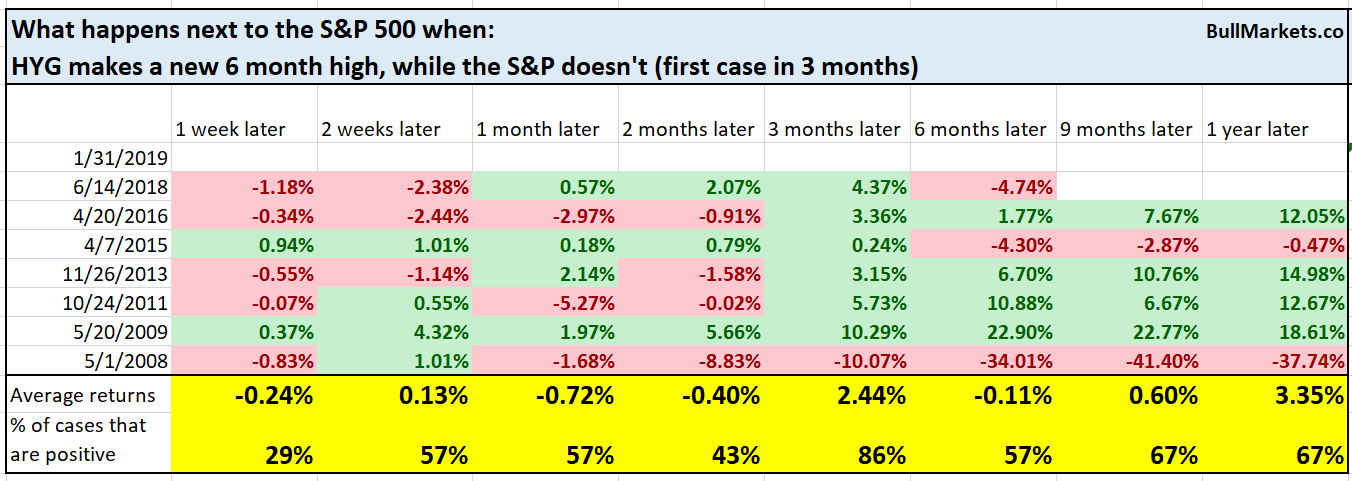
As you can see, this isn’t consistently bullish or bearish for stocks.
High Yield
High yield bonds often reflect the stock market.
- High yield bonds cratered in Q4 2018 along with the stock market
- Now that stocks are rallying, high yield bonds are rallying as well
High yield bonds have outperformed the stock market recently. iShares iBoxx $ High Yield Corporate Bond (NYSE:HYG) (high yield bond ETF) is already at new highs, while the S&P 500 is still far from its highs.
Is this bullish or bearish for stocks?
Here’s what happens next to the S&P 500 when HYG makes a new 6 month high, while the S&P 500 doesn’t
Here’s what happens next to HYG
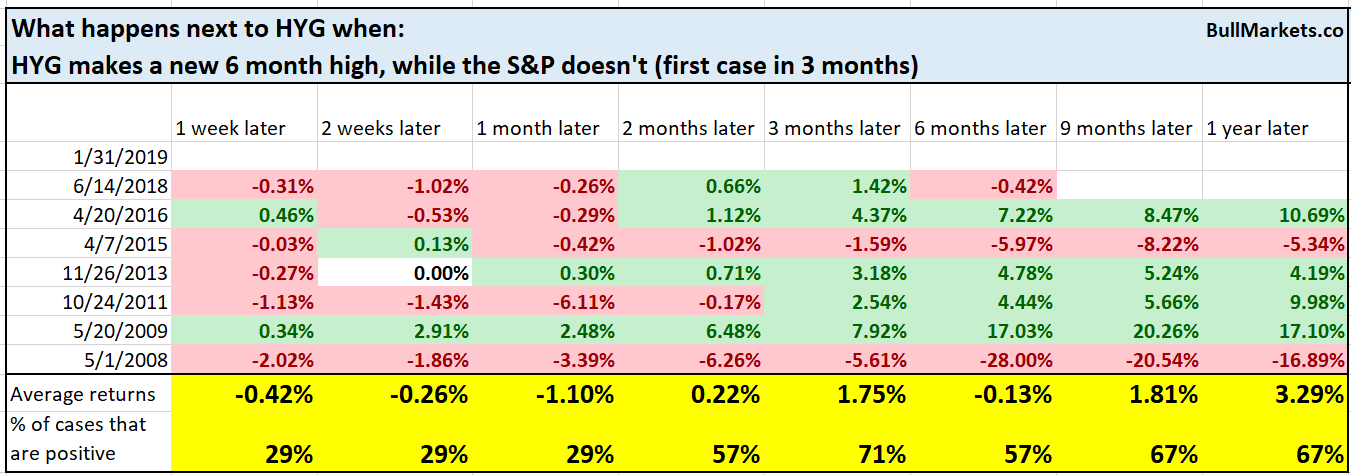
As you can see, this is more of a short term bearish sign for HYG (high yield bonds) than for stocks.
Click here for yesterday’s market study
Conclusion
Here is our discretionary market outlook:
- The U.S. stock market’s long term risk:reward is no longer bullish. This doesn’t necessarily mean that the bull market is over. We’re merely talking about long term risk:reward. Long term risk:reward is more important than trying to predict exact tops and bottoms.
- The medium term direction (i.e. next 3-6 months) is neutral. Some market studies are medium term bullish while others are medium term bearish
- The stock market’s short term has a bearish lean due to the large probability of a pullback/retest. Focus on the medium-long term (and especially the long term) because the short term is extremely hard to predict.
Goldman Sachs’ Bull/Bear Indicator demonstrates that while the bull market’s top isn’t necessarily in, risk:reward does favor long term bears.
