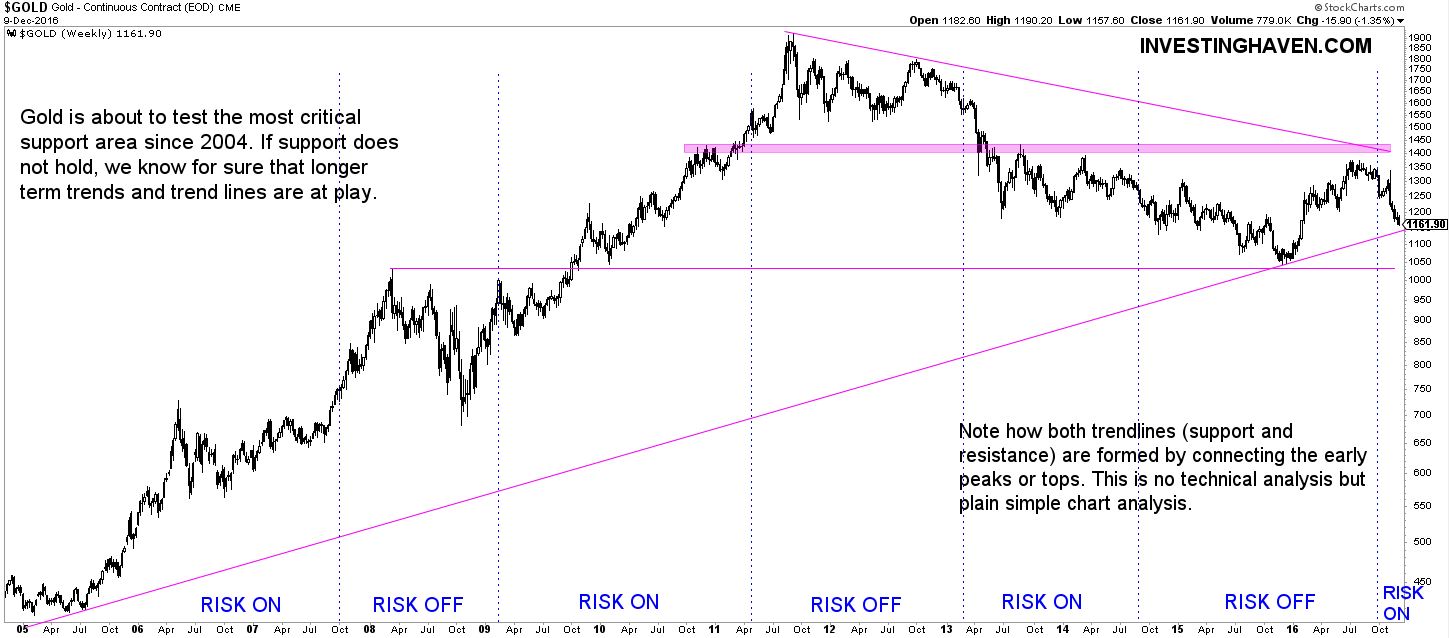
Our gold price forecast for 2017 appeared to be spot-on. Slightly after the Brexit, when the whole world was overly bullish on gold, we came out with our call that gold could have peaked. There was no voodoo or any technical analysis associated with that call. Our forecast was based on plain and simple chart analysis. Let’s revise now where gold stands on its long term chart.
Visibly, gold remains in its long term downtrend, despite its bullish energy during the first part of the year.
Looking at the last 3 years, gold seems to be stuck in a sideways pattern. For sure, that's encouraging news for gold bulls. The strong declines as witnessed in 2013 and the end of 2015 have created a support area of a sideways range.
Similar to what we said in June of this year, when we predicted that it was one of the most important months of this decade for gold, we forecast that December would also be a critical month for gold’s future. Why? As seen on the chart, gold is now about to test its long term uptrend. If the $1140 level does not hold, it is almost a given that gold will drop to the $1000 level.
Right now, risk sentiment in markets is not in favor of gold. As outlined in our market outlook 2017, gold is under pressure as we are clearly in a ‘risk-on’ environment. That does not bode well for gold for the medium-term.
We still believe, however, that gold will continue its long-term bull market at a certain point in time. Whether it will react as a fear asset or an inflationary asset remains to be seen. Because of that, it is very hard to pick an exact timing for a turnaround.
Gold’s challenging long-term chart
Interestingly, gold’s long-term chart reveals one of the most challenging aspects of gold price forecasting. We have indicated periods of risk-on and risk-off sentiment in markets, in line with intermarket dynamics and our proprietary indicators. Risk-on periods coincide with bullish phases in stock markets. However, when it comes to gold, there is no clear correlation with risk. The point is that gold can behave as a fear asset, but it can also be driven by inflationary or deflationary forces. The most challenging aspect of gold investing is to understand for which ‘reason’ gold is trending.
In sum, gold’s long-term chart reveals that two major support levels are near: $1140 and next $1000. What gold does at both price levels will be of major importance, not only to gold investors but also broad markets.

