💎 Fed’s first rate cut since 2020 set to trigger market. Find undervalued gems with Fair ValueSee Undervalued Stocks

A Long-Term Look At The S&P 500

Published 06/30/2017, 03:05 PM
Updated 07/09/2023, 06:31 AM
US500
-

With the second quarter behind us, we have an opportunity to step back and look at the bigger picture. While markets have traded so narrowly for some time now, we have all become accustomed to magnifying very small moves on the charts. They seem bigger because the range has been so narrow for so long. And with every 20-bp drop, more and more traders begin to fear that the next hit may be the big one.

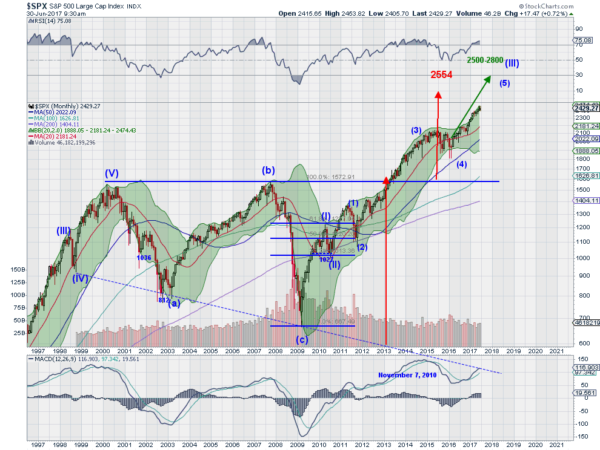
So it can be useful in this environment to step back and take a look at the forest instead of focusing on just one tree. Below is my view of the forest for the S&P 500. And it still looks positive. I have posted a version of this chart without comment each week, as part of the week-ahead summary and It has been a great guide for many years.

Monthly S&P 500

Two Technical Developments

The monthly chart shows two major patterns. The first is a simple triangle break to the upside. This pattern gives a target to 2554 on the S&P 500, still 100 points above the all-time high. The second, an Elliott Impulse Wave, is a bit more complicated. The V-Wave pattern started with the low in 2009. It made the smaller I Wave in early 2010 and pulled back to II later that year. Since then it has been building Wave III, typically the largest Wave. At the sub-level down, it is building Wave 5 of Wave III, with a target between 2500 and 2800.

Aside from the trend being a continuation higher from a quick view of the price action, momentum also supports continuation. The RSI is strong in the bullish zone. Yes, the S&P 500 pulled back from this level in the RSI in 2000 and 2007. That does not mean it will happen again. 2013 is a good example of that, when the peak in momentum worked out in a correction in the S&P over time, not price. The MACD is also climbing. In previous instances of a top, it has leveled and started to move lower. No sign of that yet.

The big picture looks just fine right now.

Latest comments

Loading next article…
Risk Disclosure: Trading in financial instruments and/or cryptocurrencies involves high risks including the risk of losing some, or all, of your investment amount, and may not be suitable for all investors. Prices of cryptocurrencies are extremely volatile and may be affected by external factors such as financial, regulatory or political events. Trading on margin increases the financial risks.
Before deciding to trade in financial instrument or cryptocurrencies you should be fully informed of the risks and costs associated with trading the financial markets, carefully consider your investment objectives, level of experience, and risk appetite, and seek professional advice where needed.
Fusion Media would like to remind you that the data contained in this website is not necessarily real-time nor accurate. The data and prices on the website are not necessarily provided by any market or exchange, but may be provided by market makers, and so prices may not be accurate and may differ from the actual price at any given market, meaning prices are indicative and not appropriate for trading purposes. Fusion Media and any provider of the data contained in this website will not accept liability for any loss or damage as a result of your trading, or your reliance on the information contained within this website.
It is prohibited to use, store, reproduce, display, modify, transmit or distribute the data contained in this website without the explicit prior written permission of Fusion Media and/or the data provider. All intellectual property rights are reserved by the providers and/or the exchange providing the data contained in this website.
Fusion Media may be compensated by the advertisers that appear on the website, based on your interaction with the advertisements or advertisers.
© 2007-2024 - Fusion Media Limited. All Rights Reserved.