Much of what has been discussed on financial news networks over the course of the past several days has centered on tariffs and the escalation into a potentially larger trade war. This is the type of negative news that the media enjoys pounding into its readers and listeners. Of course one should not put their head in the sand about potential consequences of an all out trade war, which we believe will not unfold though. To date the amount of product being impacted is just .25% of our economy. Adding some balance to the tariff discussion and the broader impact to the markets would be helpful. The one outcome I heard repeated today is the Dow Jones Index return is now slightly negative for the year. What about some of the broader indices though?
Below is a year to date chart showing the return of several indices and ETF's that represent the S&P 500 Index, the S&P Midcap Index (IJH), the S&P Small Cap Index (IWM) and the MSCI Emerging Markets Index (EEM). Clearly, all is not bleak. The small cap index is up 10.85% this year through the close on 6/19/2018. The nearly half year return for midcap stocks is a respectable 5.52% and the S&P 500 Index remains up 3.33%. Emerging markets have been the weak link and partially due to the tightening monetary policy in the U.S which I discuss a little later. 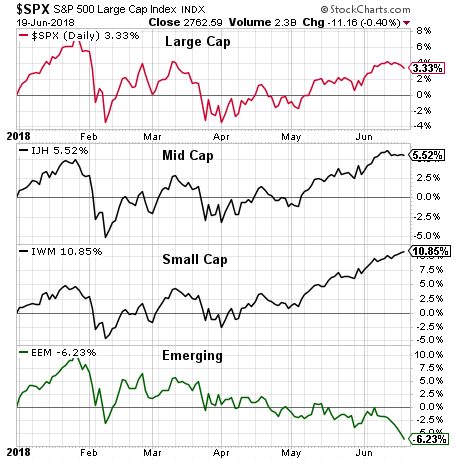
After the market peak and sell-off that began at the end of January, the S&P 500 Index has traded in about a 200 point trading range as reflected by the box outline in the below chart. In addition to the sideways trading range, the shorter term market trend is moving higher within an increasingly tighter channel. The continuation trend hinges on whether the market breaks through the red resistance line to the upside or falls below the green support line. 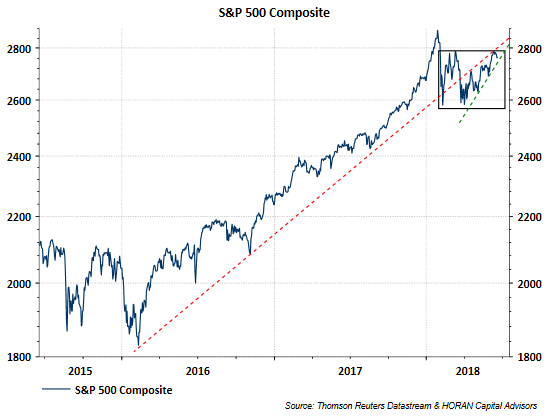
A shorter time frame of the above chart that uses year to date percentage return can be seen below. 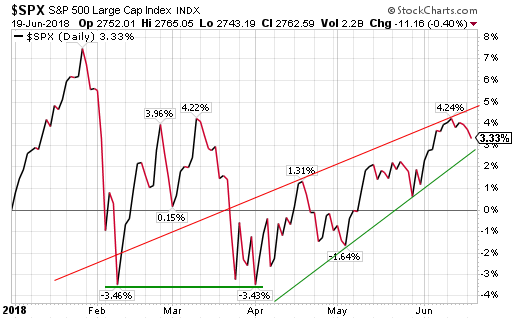
One last market chart of the S&P 500 Index is detailed below with the candlesticks reflecting price movement on a monthly basis. After the strong January performance both February and March were down months (red candles) while April, May and so far in June have been up months for the S&P 500 Index. 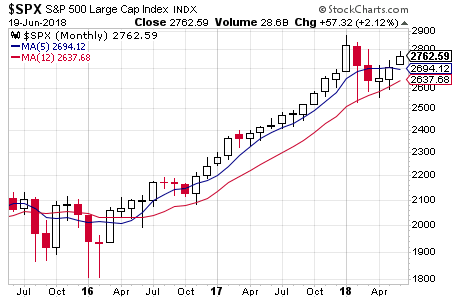
In a post I wrote in late May, Only The Good News, I discussed some positive economic and earnings charts. I will not repeat that content here; however, as it relates to the consumer, economy and earnings, much of this data is positive. Below is a chart that reflects the earnings revision ratio since the end of last month and upgrades continue to exceed downgrades. 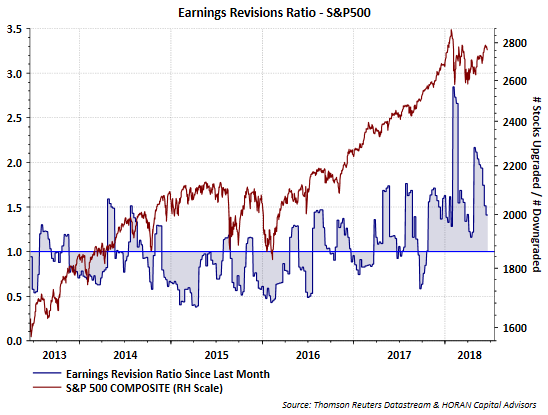
Finally, if there is one area that merits keeping a close eye on it is market interest rates. While we continue to believe the yield curve does not invert near term, the below chart is certainly beginning to challenge that point of view as the curve has flattened to 35 basis points. 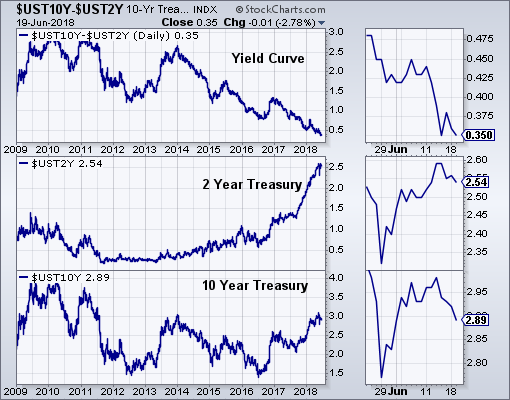
This flattening of the yield curve and more directly the Fed's continued monetary tightening is impacting emerging markets. Compounding the tightening impact is the impact tax cuts are having on the flow of US Dollars. This was discussed by Reserve Bank of India governor, Urjit Patel, in a recent article from the Business Standard, as he believes and notes:
"The US Federal Reserve should slow down its plans to shrink its balance sheet. Or else, the deluge of US treasury issuance to fund tax cuts will dry up the dollar liquidity globally, said Reserve Bank of India (RBI) governor Urjit Patel in an article in the Financial Times."
"Given the rapid rise in the size of the US deficit, the Fed must respond by slowing plans to shrink its balance sheet. If it does not, treasuries will absorb a large share of dollar liquidity. This will lead to a crisis in the rest of the dollar bond markets."
"the issue stems from Fed’s “long-awaited moves to trim its balance sheet and a substantial increase in issuing US treasuries to pay for tax cuts."
The potential repercussions to the equity market and economy that fall out of the tit-for-tat tariff battle makes the issue one investors need to keep in the forefront. However, as one looks at the economic, company level and consumer data, the positives currently outweigh the negatives at the moment. Unfortunately, positive news usually does not attract viewers and readers to the media publications; therefore receives much less attention from the media.
