It’s all eyes on today's FOMC meeting and Jay Powell’s press conference 30 minutes later. Naturally, this is a potential volatility event risk so manage your exposures according to your plan. However, today's focus turns to the yellow metal and macro story that is being portrayed here.
Gold bulls in control
It’s been a couple of months since I turned bullish on gold, and the script is working to plan. Gold is rallying in pretty much every G10 currency, which highlights its role as an alternative and my ‘best house in a bad neighborhood’ thesis.
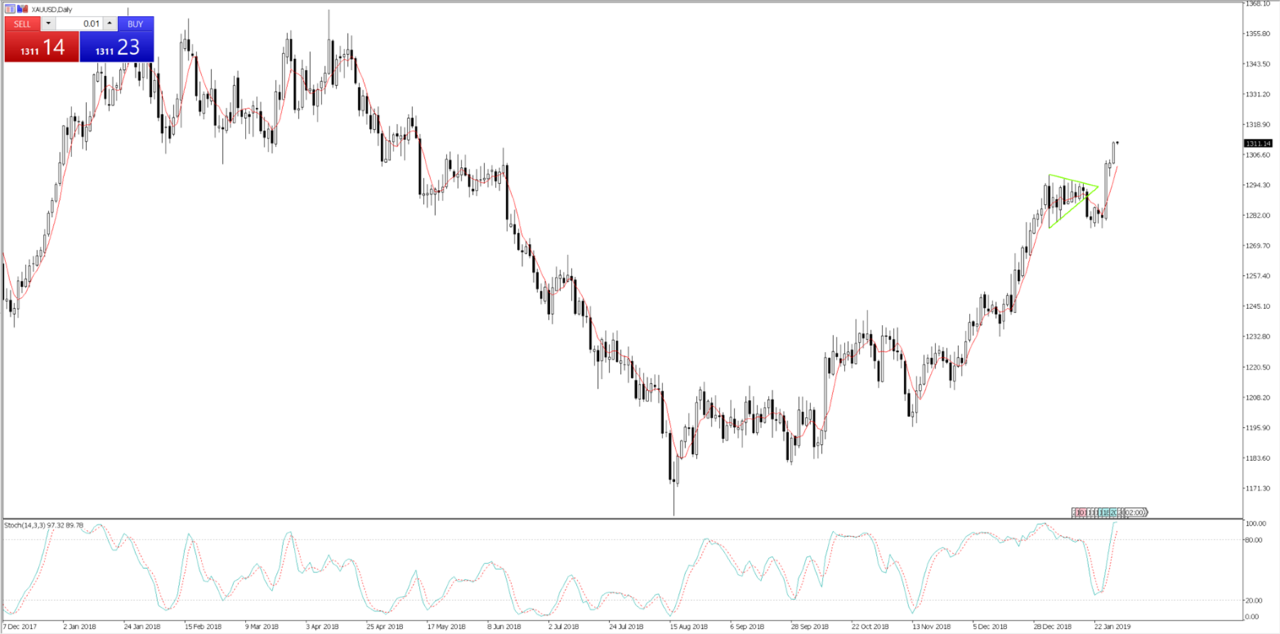
Here we see gold in USD terms. Granted, gold is overbought, but the trend is strong and the level of trend-following capital (or CTAs) now long gold futures must be quite punchy, and it would be nice to have the weekly CFTC data to see how the net long position held by managed money. For those who use it, the Commitment of Traders report is due back this Saturday.
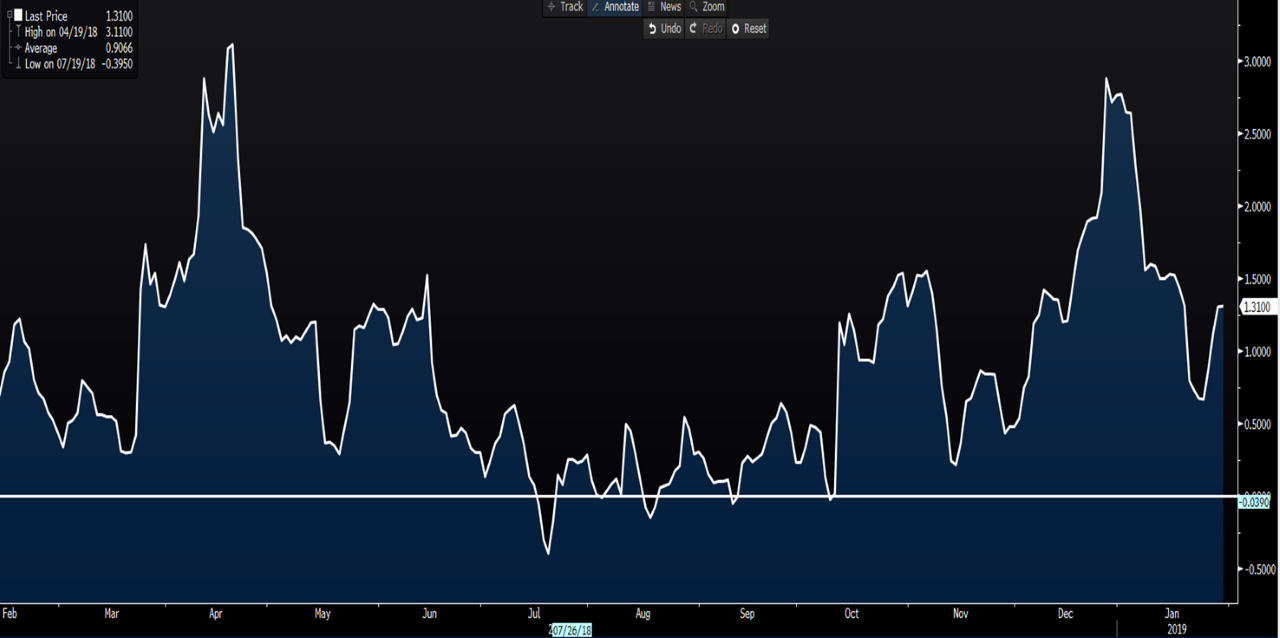
There are other positioning metrics we can look at. One of those is around the options market, where we can look at one-month risk reversals. This looks at the skew of one-month gold put volatility relative to call volatility. The more positive the number, the higher the demand for one-month gold calls. As we can see, the skew sits at 1.3x, showing traders have been buyers of upside options structures in gold, although it's not at extremes.
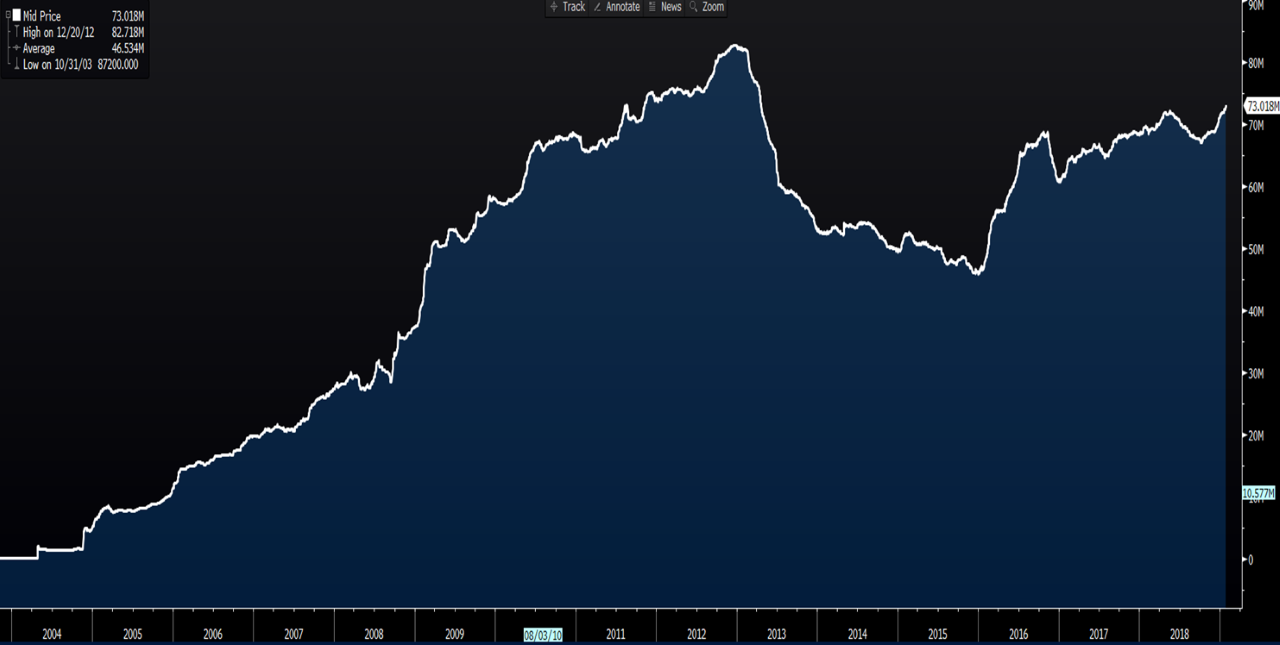
We can also look at the known ETF (exchange-traded funds) holdings of gold and see inflows into gold ETF funds have been consistent, with the current holding the highest levels since 2013. Obviously, this can go higher, and if anything, it tells us a story around current semantics.
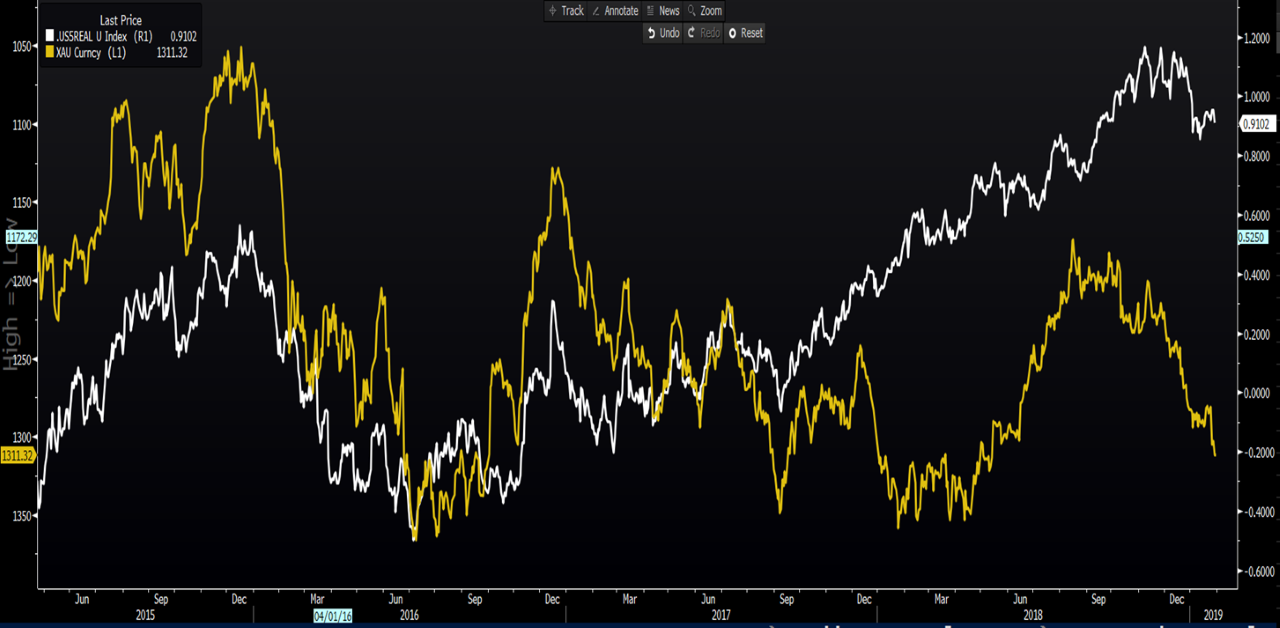
If we look at gold (yellow line) vs U.S. 5-year ‘real’ (or inflation-adjusted) yields, where I have inverted the gold price, we can see that while the correlation has broken down of late, I feel it will become more of an influence should the move lower in real yields accelerate.
The logic here is that gold has no yield, so when the real expected return in the U.S. bond market is falling, then gold looks relatively more attractive. Here, we have seen U.S. Treasury yields falling faster than that of inflation expectations, which, in turn, seem to have found support from the Oil price holding $50.
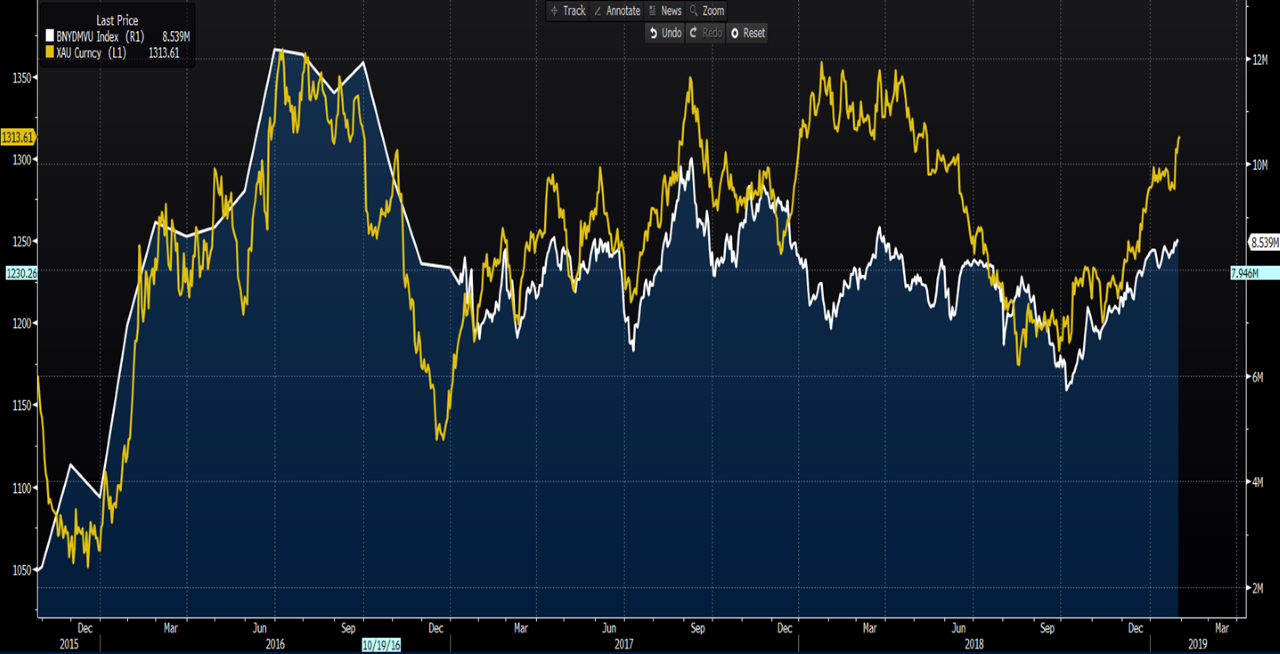
Rather than look at the U.S. bond market in isolation, perhaps a better way to look at the bond markets' influence on gold is by the level of outstanding bonds (globally) that have a negative yield.
As we can see, the USD value (the white line) of outstanding debt trading with a negative yield has been increasing. Itcurrently sits at $8.5 trillion, and gold seems to be tracking this closely. We can derive that gold is a hedge against deteriorating global economics, and the idea of owning precious metals as a hedge against inflation seems to be wholly incorrect. It makes the idea of owning gold as part of a diverse portfolio credible.
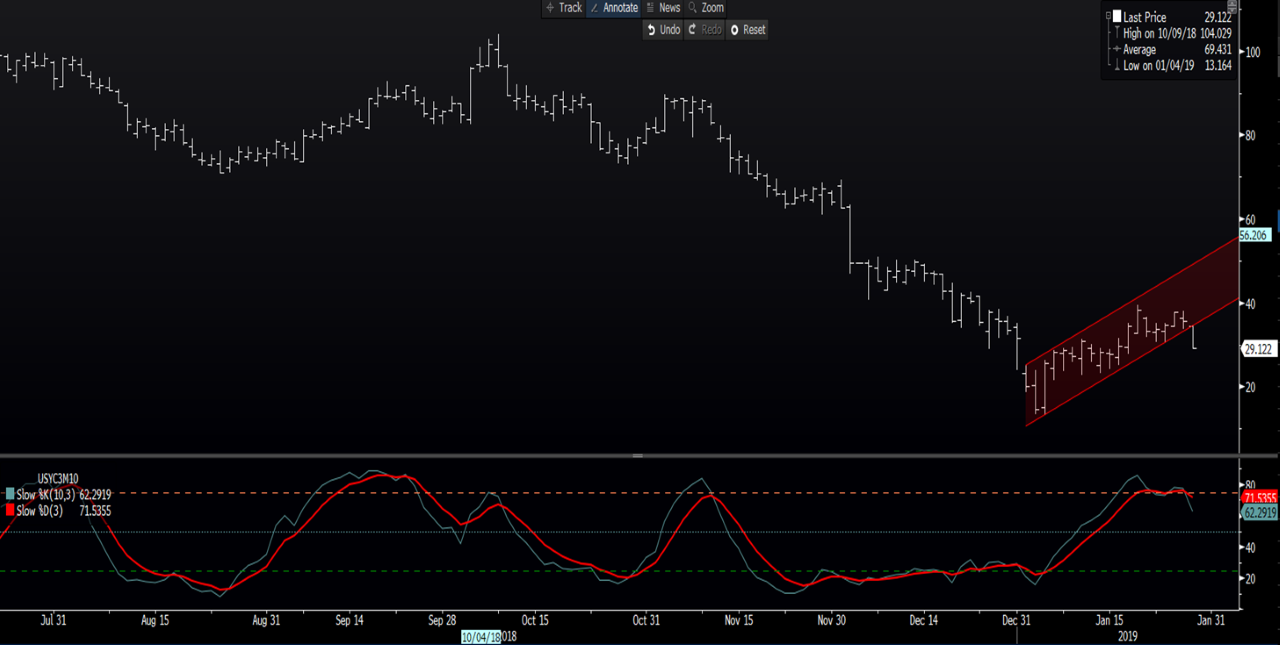
We can also look at the yield curve as a sign of falling longer-term inflation expectations. The Fed has put out numerous white papers about which part of the yield curve they feel is the most accurate at forecasting recessions, and they have made it clear they look at the differential between 3-month Treasuries and 10-year Treasuries.
As we can see below, the spread has started to narrow (or flatten) again and has broken down through a bear flag pattern. A flatter curve should support gold appreciation.
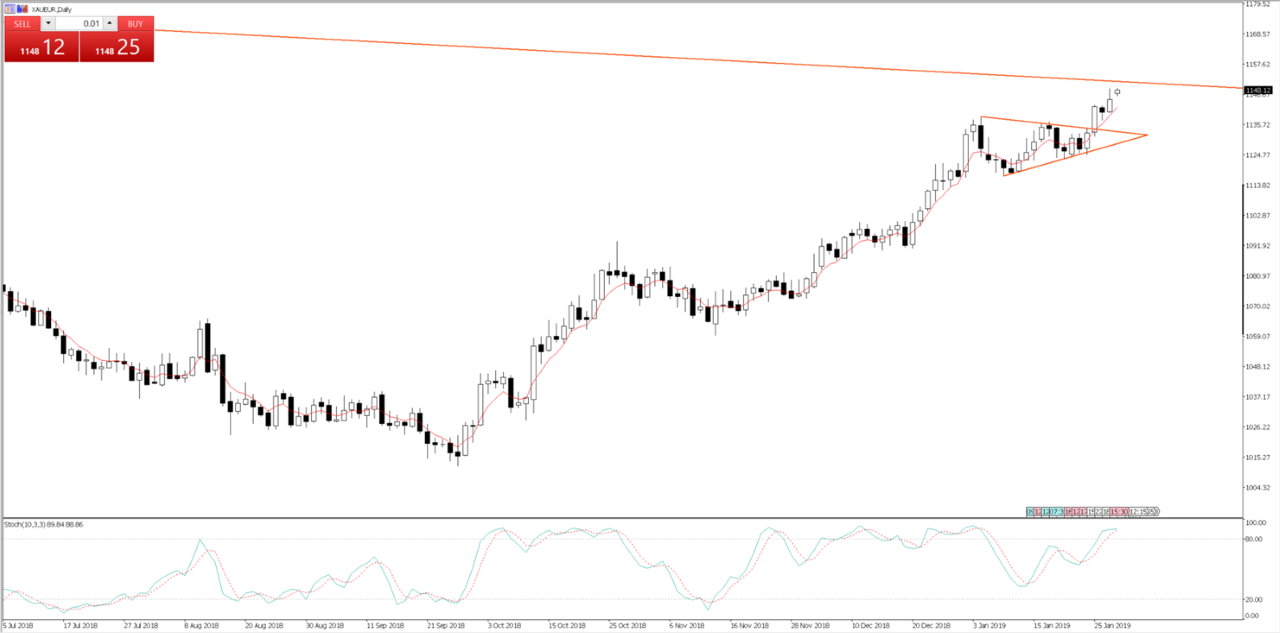
Gold in EUR terms (XAUEUR on MT5) is trending beautifully and eyeing a test of the downtrend drawn from the 2012 (and its all-time) high at 1148. It wouldn’t be too hard to think we get sellers here, but a break should be noted and would add to the bullish sentiment.
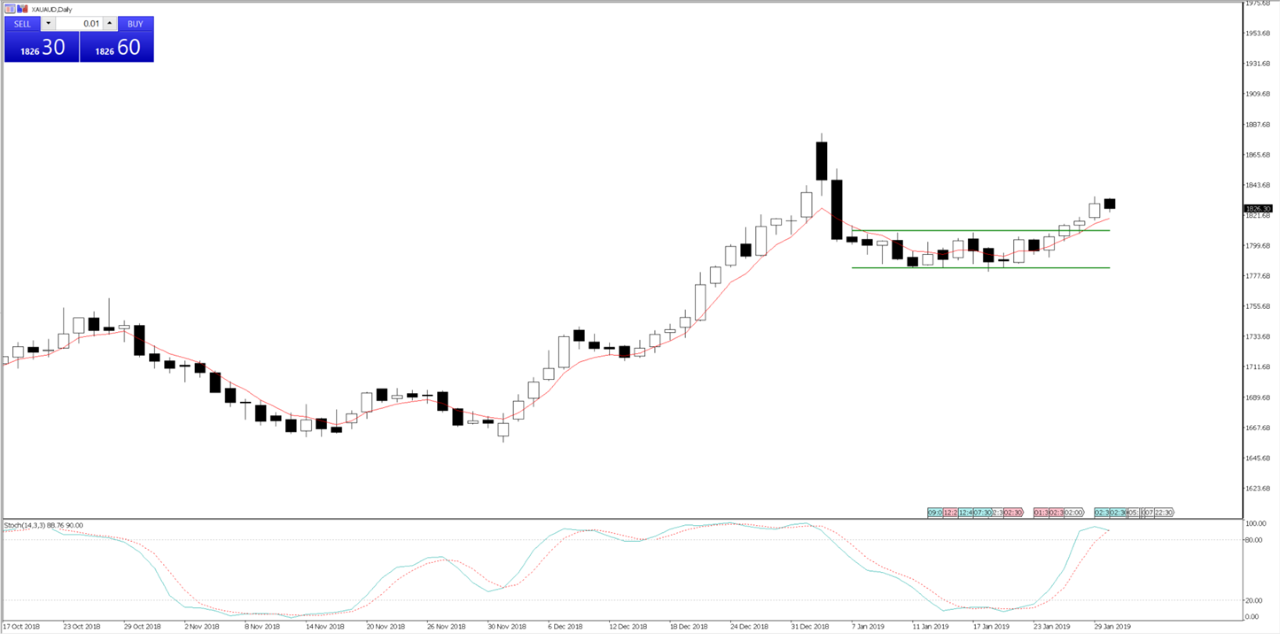
Gold in AUD terms (XAUAUD) – A small beat in today’s Aussie Q4 headline CPI at 1.8% YoY, has seen AUDUSD rally 40-pips into 0.7190. The market had gone into the print positioned for a CPI print closer to 1.5% to 1.6%. In the rates market, we have seen the implied probability of a rate cut from the RBA by December drop from 43% to 36%.
That said, unless traders genuinely feel the prospects of positive resolution from this week’s U.S.-Sino trade talks are on the cards, then I would be selling AUDUSD above 0.7210, which should see AUD gold move progressively higher again.
On the daily chart, we can price breaking out of the consolidation range, and while the price has pulled back by a modest 0.4% today, the price is still holding above the 5-day EMA, which is also trending higher. So, the base case is to expect higher levels.
Other charts of interest
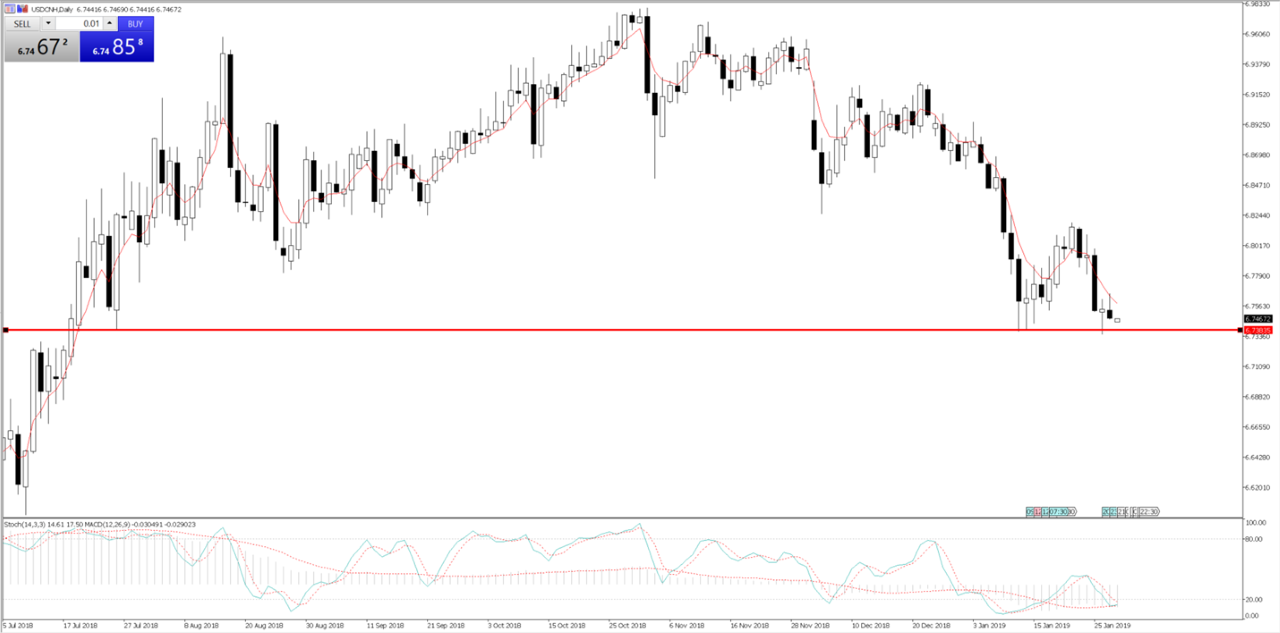
USDCNH – Still holding key horizontal support. Happy to be short on a closing break.
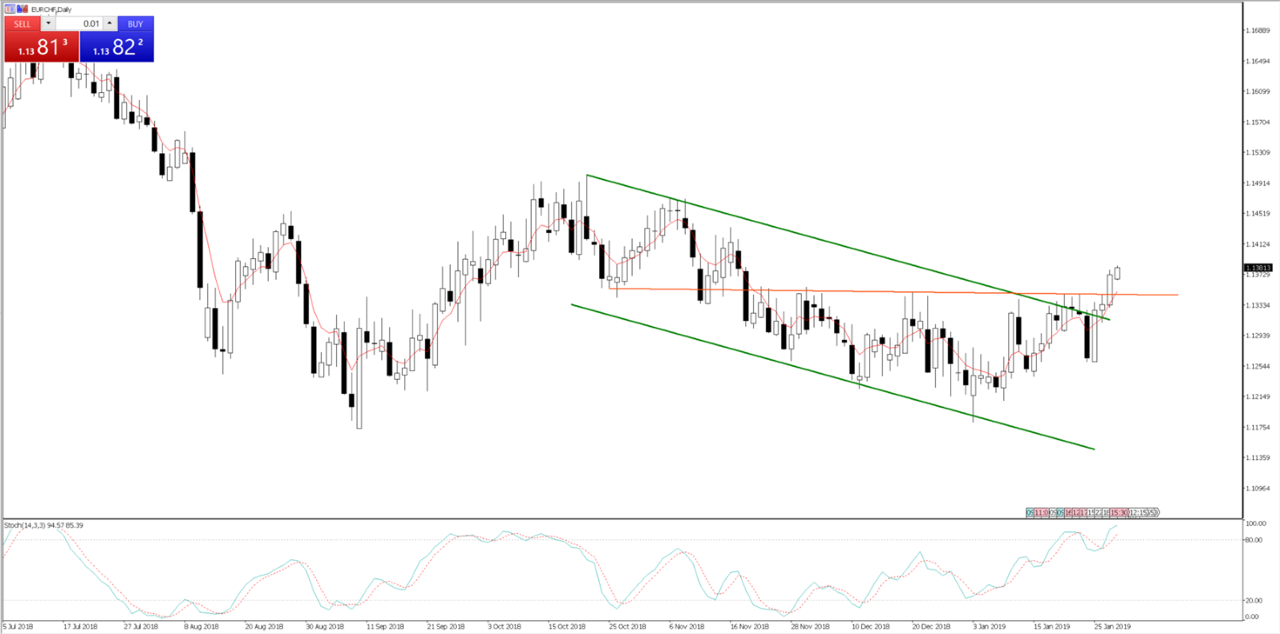
EURCHF – A chart I put on the radar last week. Price has now closed above horizontal resistance, and longs are preferred for 1.1490
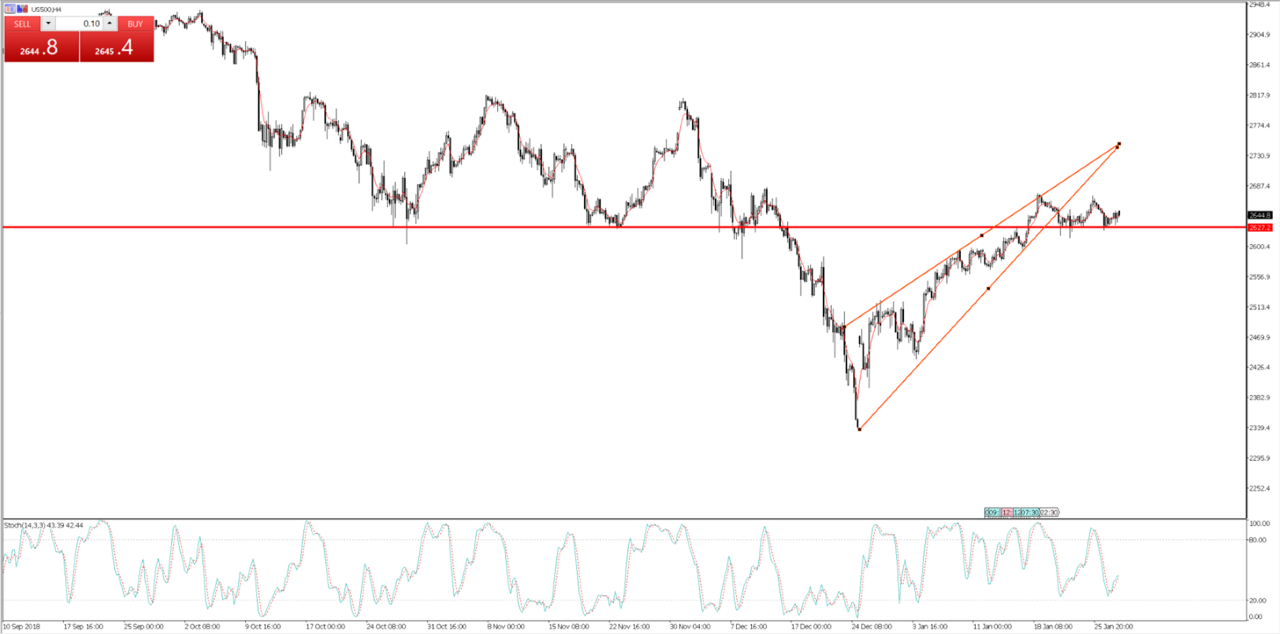
S&P 500 (4-hour chart) – Apple (NASDAQ:AAPL) should support the cash market in upcoming trade, given its after-market performance. That said, S&P 500 futures are unchanged and not getting too carried away. I will be reducing risk positioning and look at shorts, on a close through 2627 – the red line.
