Investing.com’s stocks of the week
Most ETF portfolios I look through are heavily weighted towards large-cap stocks as the fundamental building blocks of an equity allocation. Those who might have a higher risk tolerance or seek greater diversification qualities may also own some small cap exposure as a component of their investment strategy as well. Because of this barbell type positioning, the most easily overlooked area is the middle ground known as mid-cap stocks.
Investopedia defines mid-cap stocks as those companies with market capitalizations between $2-$10 billion. While those are fair guidelines, in practice there are many indexes that stretch the bounds of their capitalization requirements to even wider ranges. Much of this is likely due to the extreme range of the large-cap group, which stretch from a lower bound of $10+ billion all the way to upwards of $800 billion at present market conditions.
Mid-cap stocks share many positive qualities that should endear themselves to a long-term investment portfolio. Many of these companies have outgrown the small cap definition through stable and capable business practices. They often show less speculative qualities than micro or small-cap stocks and more attractive growth characteristics than their lumbering large-cap peers.
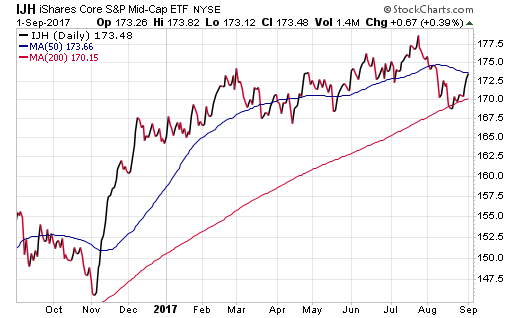
The biggest exchange-traded fund that tracks this group is the iShares S&P Midcap 400 (NYSE:IJH), which has more than $39 billion in assets under management. IJH is a portfolio of 400 U.S. equity holdings that have market capitalizations consistent with the ranges mentioned above. The fund charges a miniscule expense ratio of just 0.07% to access this wide array of holdings and is quite tax-efficient in its minimal portfolio turnover ratio.

As its name implies, IJH is designed to be used as a core holding and its key attributes promote that concept. It’s highly diversified, low-cost, tax-efficient, liquid, and transparent. Those qualities make for a vehicle that is easy to understand and provides instant exposure to virtually the entire market cap segment.
Other popular funds in the “core” category include the Vanguard Mid-Cap (NYSE:VO) and the SPDR S&P MidCap 400 (NYSE:MDY). Both offer similar characteristics and performance attribution with some minor differences in underlying portfolio exposure guidelines and costs. Choosing one fund versus another may simply be an exercise in familiarity or fund company preference more than anything else.
There are also many unique ETFs that introduce additional factor criteria to the mid-cap group as well. One example is the WisdomTree MidCap Dividend (NYSE:DON). This ETF has $2.8 billion dedicated to nearly 400 U.S. dividend paying stocks. Companies within DON are ranked and weighted according to their aggregate cash payouts, which gives the largest share of assets to the companies paying the biggest dividends. The fund charges an expense ratio of 0.38% and income is paid monthly to shareholders.
Another popular ETF is the PowerShares S&P MidCap Low Volatility Portfolio (NYSE:XMLV), which targets U.S. stocks that have shown historically lower price fluctuations than their peers. This fund currently owns a more concentrated portfolio of 80 companies and has attracted over $1.1 billion in total assets. It charges a modest 0.25% expense ratio to implement this low volatility strategy.
There are also several mid-cap ETFs that segment companies according to growth or value characteristics, equal-weighted measures, earnings factors, price trends, and even ethical standards. This comprehensive factor spectrum provides investors with a highly diverse menu to customize their portfolio according to their goals or intrinsic values.
The Bottom Line
Parceling out the appropriate allocations to various market capitalizations can be a daunting task. Fortunately, many “total market” index mutual funds and ETFs implement this automatically to create a well-rounded stock exposure profile. Those that want to further customize their investments can use one or two of these mid-cap ETFs to supplement existing large or small-cap exposure in a truly diversified portfolio strategy.
The views and opinions expressed herein are the views and opinions of the author and do not necessarily reflect those of NASDAQ, Inc.
Disclosure: FMD Capital Management, its executives, and/or its clients June hold positions in the ETFs, mutual funds or any investment asset mentioned in this article. The commentary does not constitute individualized investment advice. The opinions offered herein are not personalized recommendations to buy, sell or hold securities.
