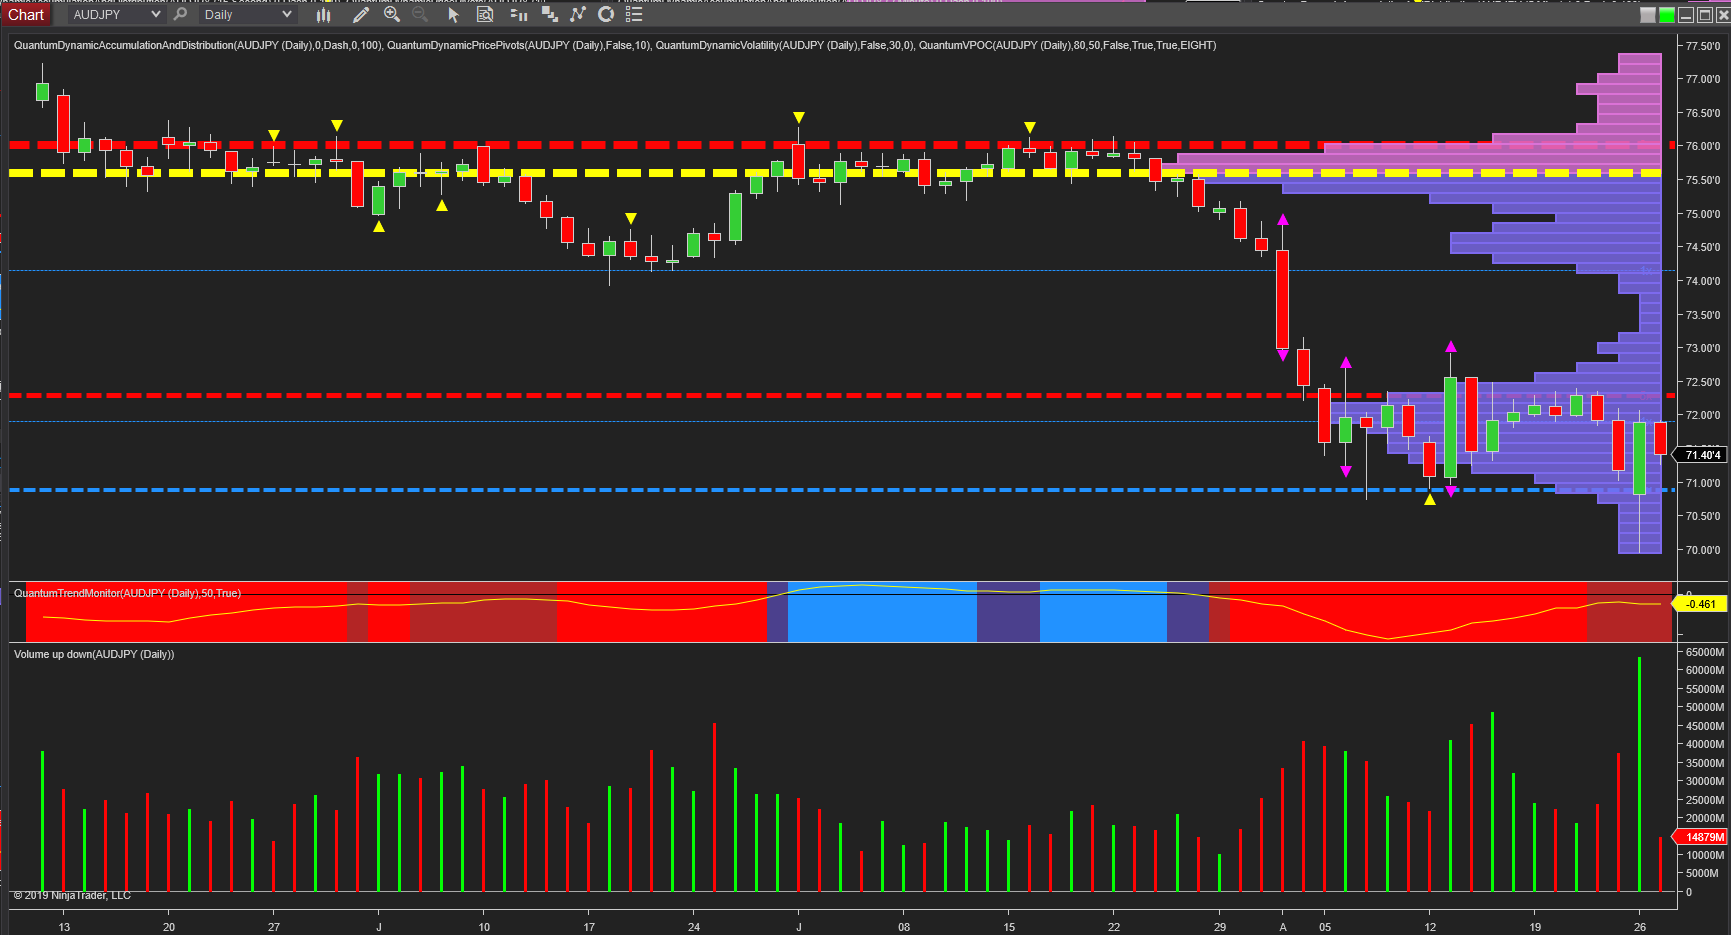
A fascinating day on the markets yesterday and not least for forex, which not only had some dramatic price action but unusually accompanied with ultra high volume on a day when the London markets were effectively thin for the Bank Holiday. And whilst there were several examples in the Yen complex, it is the AUD/JPY which catches the eye in terms of price action and volume, and also as a risk currency pair, duly reflecting the up day for US equities, with all three indices of the YM, ES and NQ rising strongly, yet continuing to trade in consolidation on the daily timeframes.
This has been reflected in the AUD/JPY where it has remained rangebound between 71.00 to the downside and 72.40 to the upside. And following yesterday’s dramatic move, the question is for how much longer? The day began with a plunge lower, at one point creeping below the 70.00 level to trade at 69.95, before recovering as US markets rose strongly, with the AUD/JPY joining the move higher to close the day at 71.88 – a substantial move for the pair, which generally trades between 80 to 100 pips.
However, note the volume associated with the candle, it is ultra high and exceeds any from the previous months, and signalling sustained buying when we consider a candle with such a deep lower wick. The two regions of support and resistance outlined above are now key, and for a longer-term recovery for a pair which has been in a long term bearish trend, the ceiling of resistance at 72.40 is now one of many levels, which will become increasingly significant over the next few weeks and months along with the volume point of control at 75.50 and the associated resistance in this area.
Note to the low volume region on the volume point of control histogram between 73.00 and 74.00 which will help in any recovery. However, after such a long decline any reversal is unlikely to be swift, with further volatility and consolidation at the current level, and no doubt reflected in US equities as the turbulent relationship between the US and China over tariffs continues to whipsaw the markets on a daily basis. Nevertheless, yesterday was the first sign of significant stopping volume and buying, and no doubt will be mirrored with further such price and volume days.
Finally, notice the trend monitor indicator is in a change condition transitioning to dark red and rotating away from bright red, another potential signal of a change in trend.
